Climate Prediction
Introduction
The meteoblue Climate Prediction provides an understanding about the arising risks of climate change for any specific location on Earth. It shows the past and most likely future development of more than 20 variables, including air temperature, precipitation amount and wind speed.
Nowadays, many regions worldwide cope with challenges such as extreme air temperatures, storm events, and heavy precipitation. In the future, these problems will occur more often due to climate change. This trend will result in an unknown amount of economic damage and endanger the life and health of the population. In many parts of the world, heatwaves presently kill more people than any other natural hazard, and there is a strong observable tendency for this phenomenon to increase.
Climatic patterns of temperature, rainfall, wind, and irradiation are changing, driven by increased levels of CO in the atmosphere. Some regions of the world are affected more by climate change (e.g. Arctic region), others less (tropical regions). Changes in meteorological parameters are described by climate change scenarios in reports published by IPCC. These scenarios are plausible projections of the future climate with an associated uncertainty range. Climate change scenarios typically use climate projections based on different projected greenhouse gas emissions and other factors such as future population levels, economic activity, etc. They span a wide range of possible future developments.
Organisations need to consider the impact of climate change on both their strategic plans and their daily operations. Due to the inherent uncertainty of climate change scenarios organisations must anticipate and manage their exposure to climate-related risks. meteoblue weather and climate data and services support these processes with high quality data including uncertainty information.
Configuration
Data are delivered in form of csv/json files and png images. Several different configuration options can be chosen below. Reports will be delivered on request.
| Default | Comments | |
|---|---|---|
| Choose location | single location | area |
| Choose reference period | 1979-2009 | At least 20 years reference period are recommended |
| Choose time horizons | 2020 – 2049, 2045 – 2074, 2070 – 2099 | Any combination and length of time period is possible |
| Choose RCP scenario | RCP8.5 | RCP2.6, RCP4.5, RCP6.0 |
| Choose RCP ensemble | mean | min, mean, max |
| Choose aggregation | yearly | yearly, seasonal, monthly |
| Choose variable | See variable list | |
| Choose resolution | 30 km | 1 km, 10 m (only temperature related parameters, on request) |
| Choose format | csv | png, json |
Choose Location
We offer five different options:
- Select specific locations (latitude and longitude is required), A “location ID” can be set optional, which will then used for the naming of the output files. Example: lat = [47.56, 47.37, 52.52], lon = [7.59, 8.54, 13.40], locationID = [“Basel”, “Zürich”, “Berlin”] in WGS84 decimal coordinates. In this example, three climate prediction profiles are calculated for Basel, Zürich and Berlin.
- Select an entire area
- Polygon (e.g. a country)
- Latitude Longitude box (lat_min = 47.0, lat_max = 52.0, lon_min = 7.0, lon_max = 14.0) in WGS84 decimal coordinates.
- Aggregation of an area to a location Example: Aggregation of all ERA5 pixel values within the states in Germany, resulting in 16 climate prediction profiles for all German states.
Note, that the analysis is based on the ERA5 grid cell (30 x 30 km) in which the selected coordinate is located.
Choose Reference Period
The default reference period is set to a 40 year time period starting from 1979 until 2019. Any other reference period can be chosen between 1979 and 2019. At least 20 years reference period are recommended.
Choose Time Horizons
Future time horizons are characterized by two parameters:
- Centred year (e.g. 2035)
- Time period (e.g. 30 years averaging)
For example, the time horizon 2020 – 2049 has the centred year 2035 and a time period of 30 years. The default time horizons are 2020 – 2049, 2045 – 2074 and 2070 – 2099. Note that any other options can be chosen by the user.
Choose RCP Scenario
Four different emission scenarios can be chosen:
- RCP2.6
- RCP4.5
- RCP6.0
- RCP8.5
Choose RCP Ensemble
Three different RCP ensembles can be chosen:
- Ensemble mean
- Ensemble max (95th percentile of all ensemble members)
- Ensemble min (5th percentile of all ensemble members)
Choose Aggregation
Three different aggregation options can be chosen:
- Yearly aggregation
- Seasonal aggregation
- Monthly aggregation
Note that daily aggregations for climate change scenarios are not offered, caused by the monthly temporal resolution of the most variables.
Choose Variable
| Air Temperature | Description | Yearly Availability | Seasonal Availability | Monthly Availability |
|---|---|---|---|---|
| Air temperature average | Average of mean daily air temperature | yes | yes | yes |
| Number of frost days | Minimum daily temperature < 0 °C | yes | yes | yes |
| Number of ice days | Maximum daily temperature < 0 °C | yes | yes | yes |
| Number of tropical nights | Minimum daily temperature > 20 °C | yes | yes | yes |
| Number of summer days | Maximum daily temperature > 25 °C | yes | yes | yes |
| Number of heat days | Maximum daily temperature > 30 °C | yes | yes | yes |
| Heating degree days | Summation of the daily mean air temperatures which are below the threshold 15.5 °C | yes | yes | yes |
| Cooling degree days | Summation of the daily mean air temperatures which are above the threshold 15.5 °C | yes | yes | yes |
| Length of frostfree period | Number of days between the last and first frost day of the year | yes | no | no |
| Warm spell duration index | Number of days where at least 6 consecutive days reach the 90th percentile of the reference period (daily maximum temperature) | yes | no | no |
| Cold spell duration index | Number of days where at least 6 consecutive days reach the 10th percentile of the reference period (daily minimum temperature) | yes | no | no |
| Precipitation | Description | Yearly Availability | Seasonal Availability | Monthly Availability |
|---|---|---|---|---|
| Precipitation sums | Summation of daily precipita-tion sums | yes | yes | yes |
| Heavy precipitation events | Number of days with a daily precipitation sum > 25 mm | yes | yes | yes |
| Aridity index | Standardised precipitation index | yes | yes | yes |
| Aridity index | Standardised precipitation and evaporation index | yes | yes | yes |
| Wind | Description | Yearly Availability | Seasonal Availability | Monthly Availability |
|---|---|---|---|---|
| Air wind speed | Average mean daily wind speed | yes | yes | yes |
| Number of storm days | Number of days with a daily wind gust maximum > 80 km/h | yes | yes | yes |
Choose Resolution
The default horizontal resolution is defined by the size of the ERA5 grid cell (30 x 30km). Please contact [email protected], if a downscaling to 1 km (based on elevation) or a downscaling to 10 m (to resolve the urban heat island effect) is required. Downscaling to 10 m is only available in selected cities.
Choose Download Options
Data are provided in csv format and pdf format (see Example case below)
Location-Specific Climate Prediction: Example London
The following figures and graphs are available for each pixel worldwide by combining ERA5 historical data with the climate projections of the different emission scenarios, exemplarily shown for London, Great Britain.
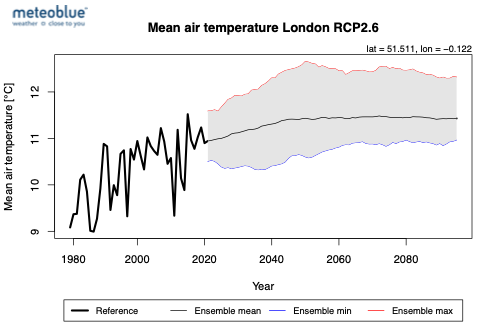
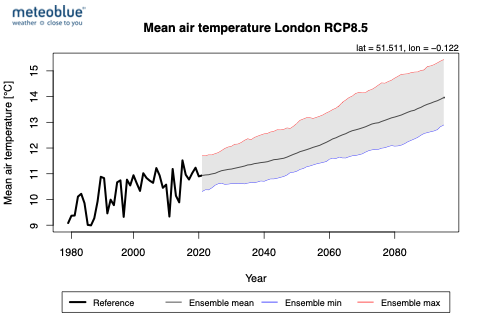
Figure 1: Number of heat days as a function of different years from 1979 until the year 2100. For historical data, ERA5 data are used, climate projections from 2020 towards the end of the century are calculated with four different emission scenarios. The ensemble mean is shown in black, the lower minimum of the ensemble members in blue, the upper maximum of the ensemble members in red.
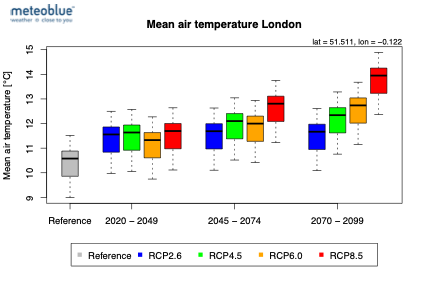
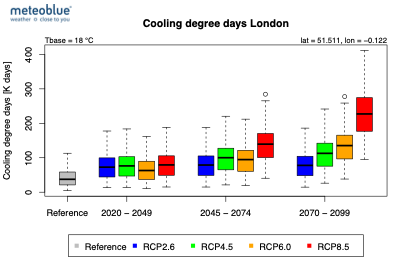
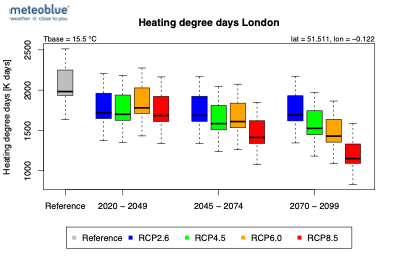
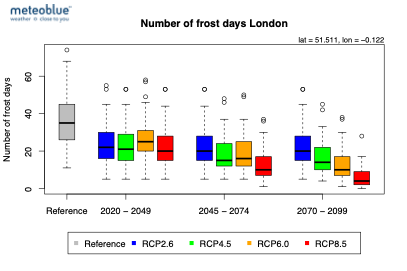
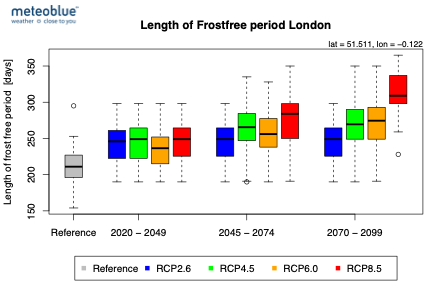
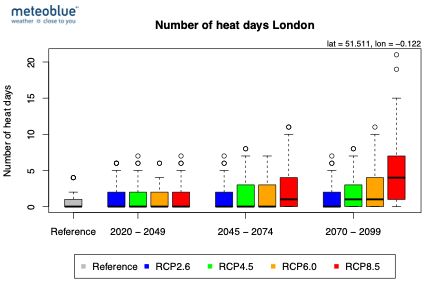
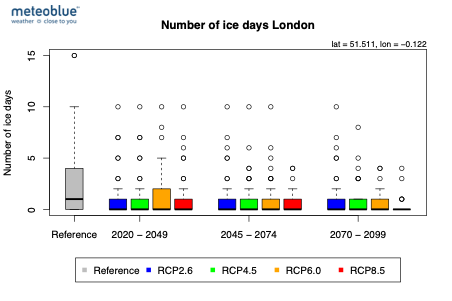
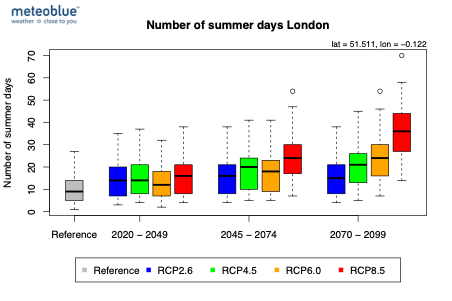
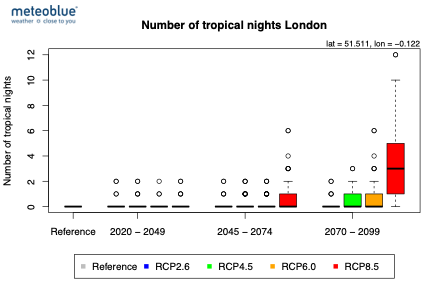
Figure 2: Number of ice days, frost days, summer days, hot days, length of frostfree period, heating degree days, cooling degree days, average temperature and tropical nights for the reference period (1979-2019), four emission scenarios (RCP2.6, RCP4.5, RCP6.0, RCP8.5) and three time horizons (2035, 2060, 2085)
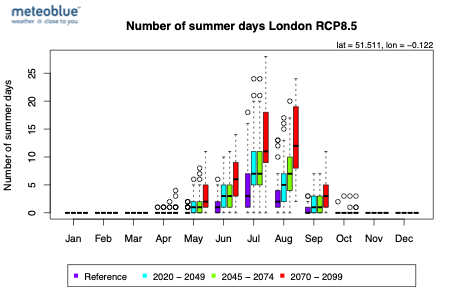
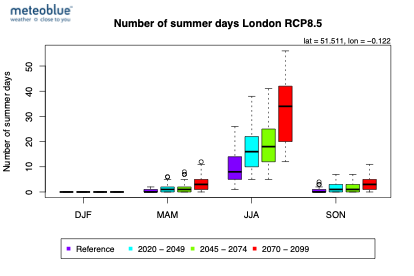
Figure 3: Number of summer days for the reference period (1979-2019) and three time horizons (2035, 2060, 2085) for the RCP8.5 scenario in monthly aggregation (left) and seasonal aggregation (right).
Maps
Example: Mapping Climate Data for Specific Locations
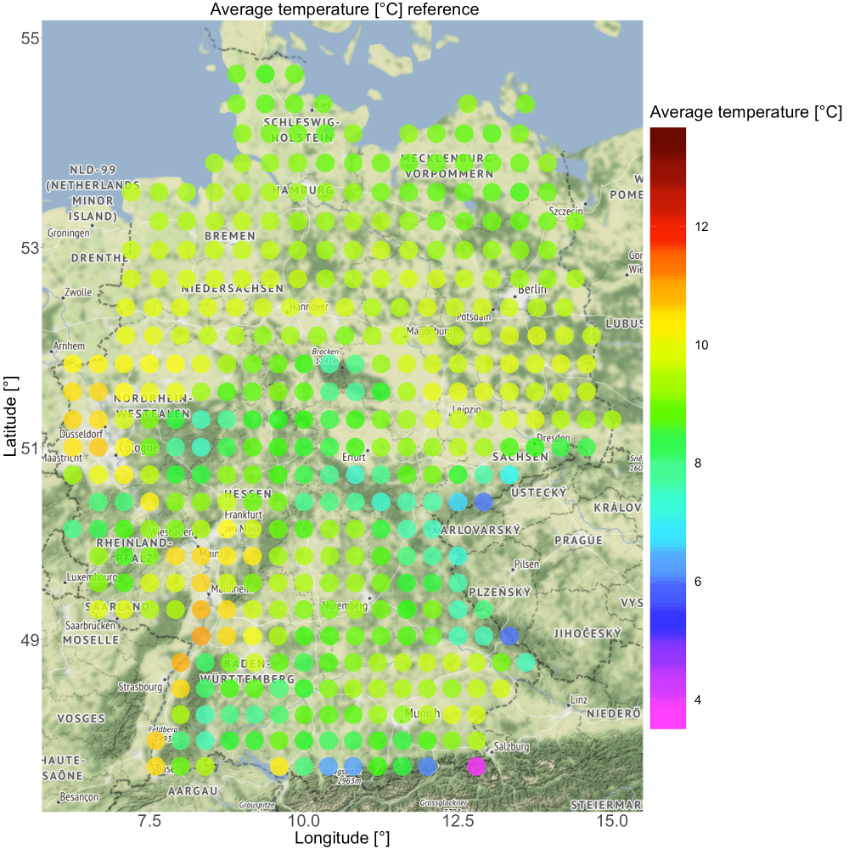
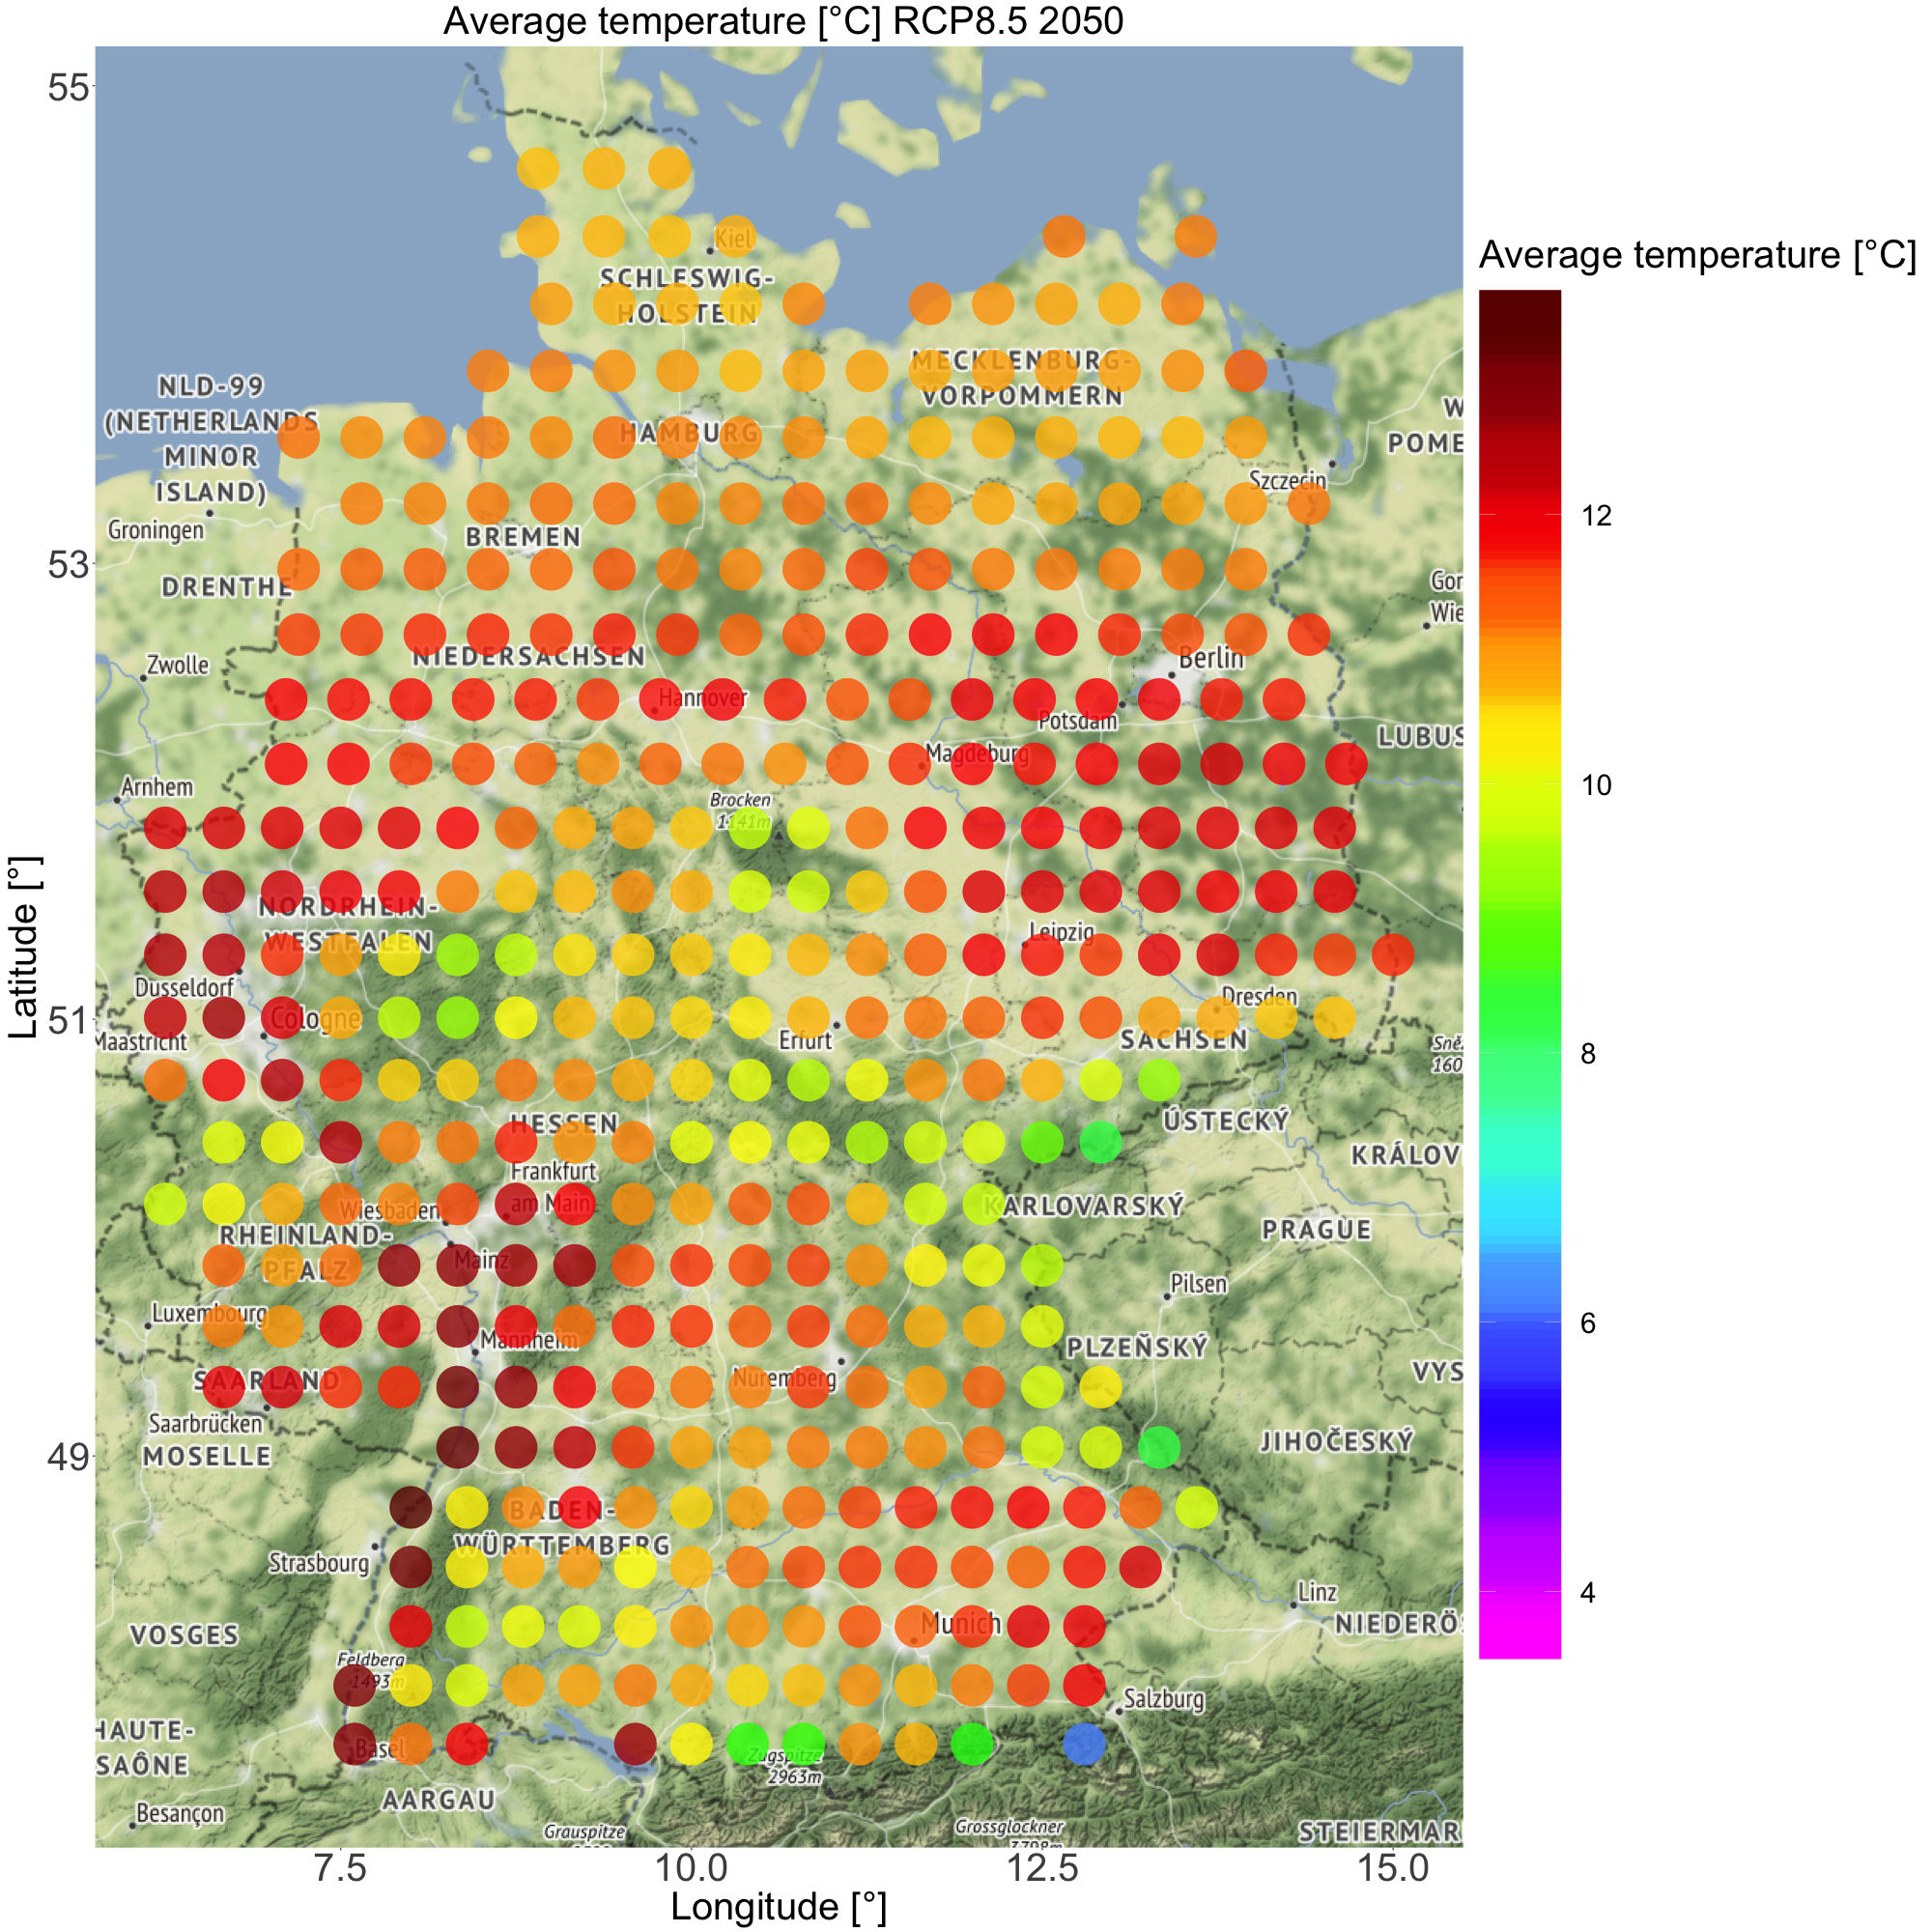
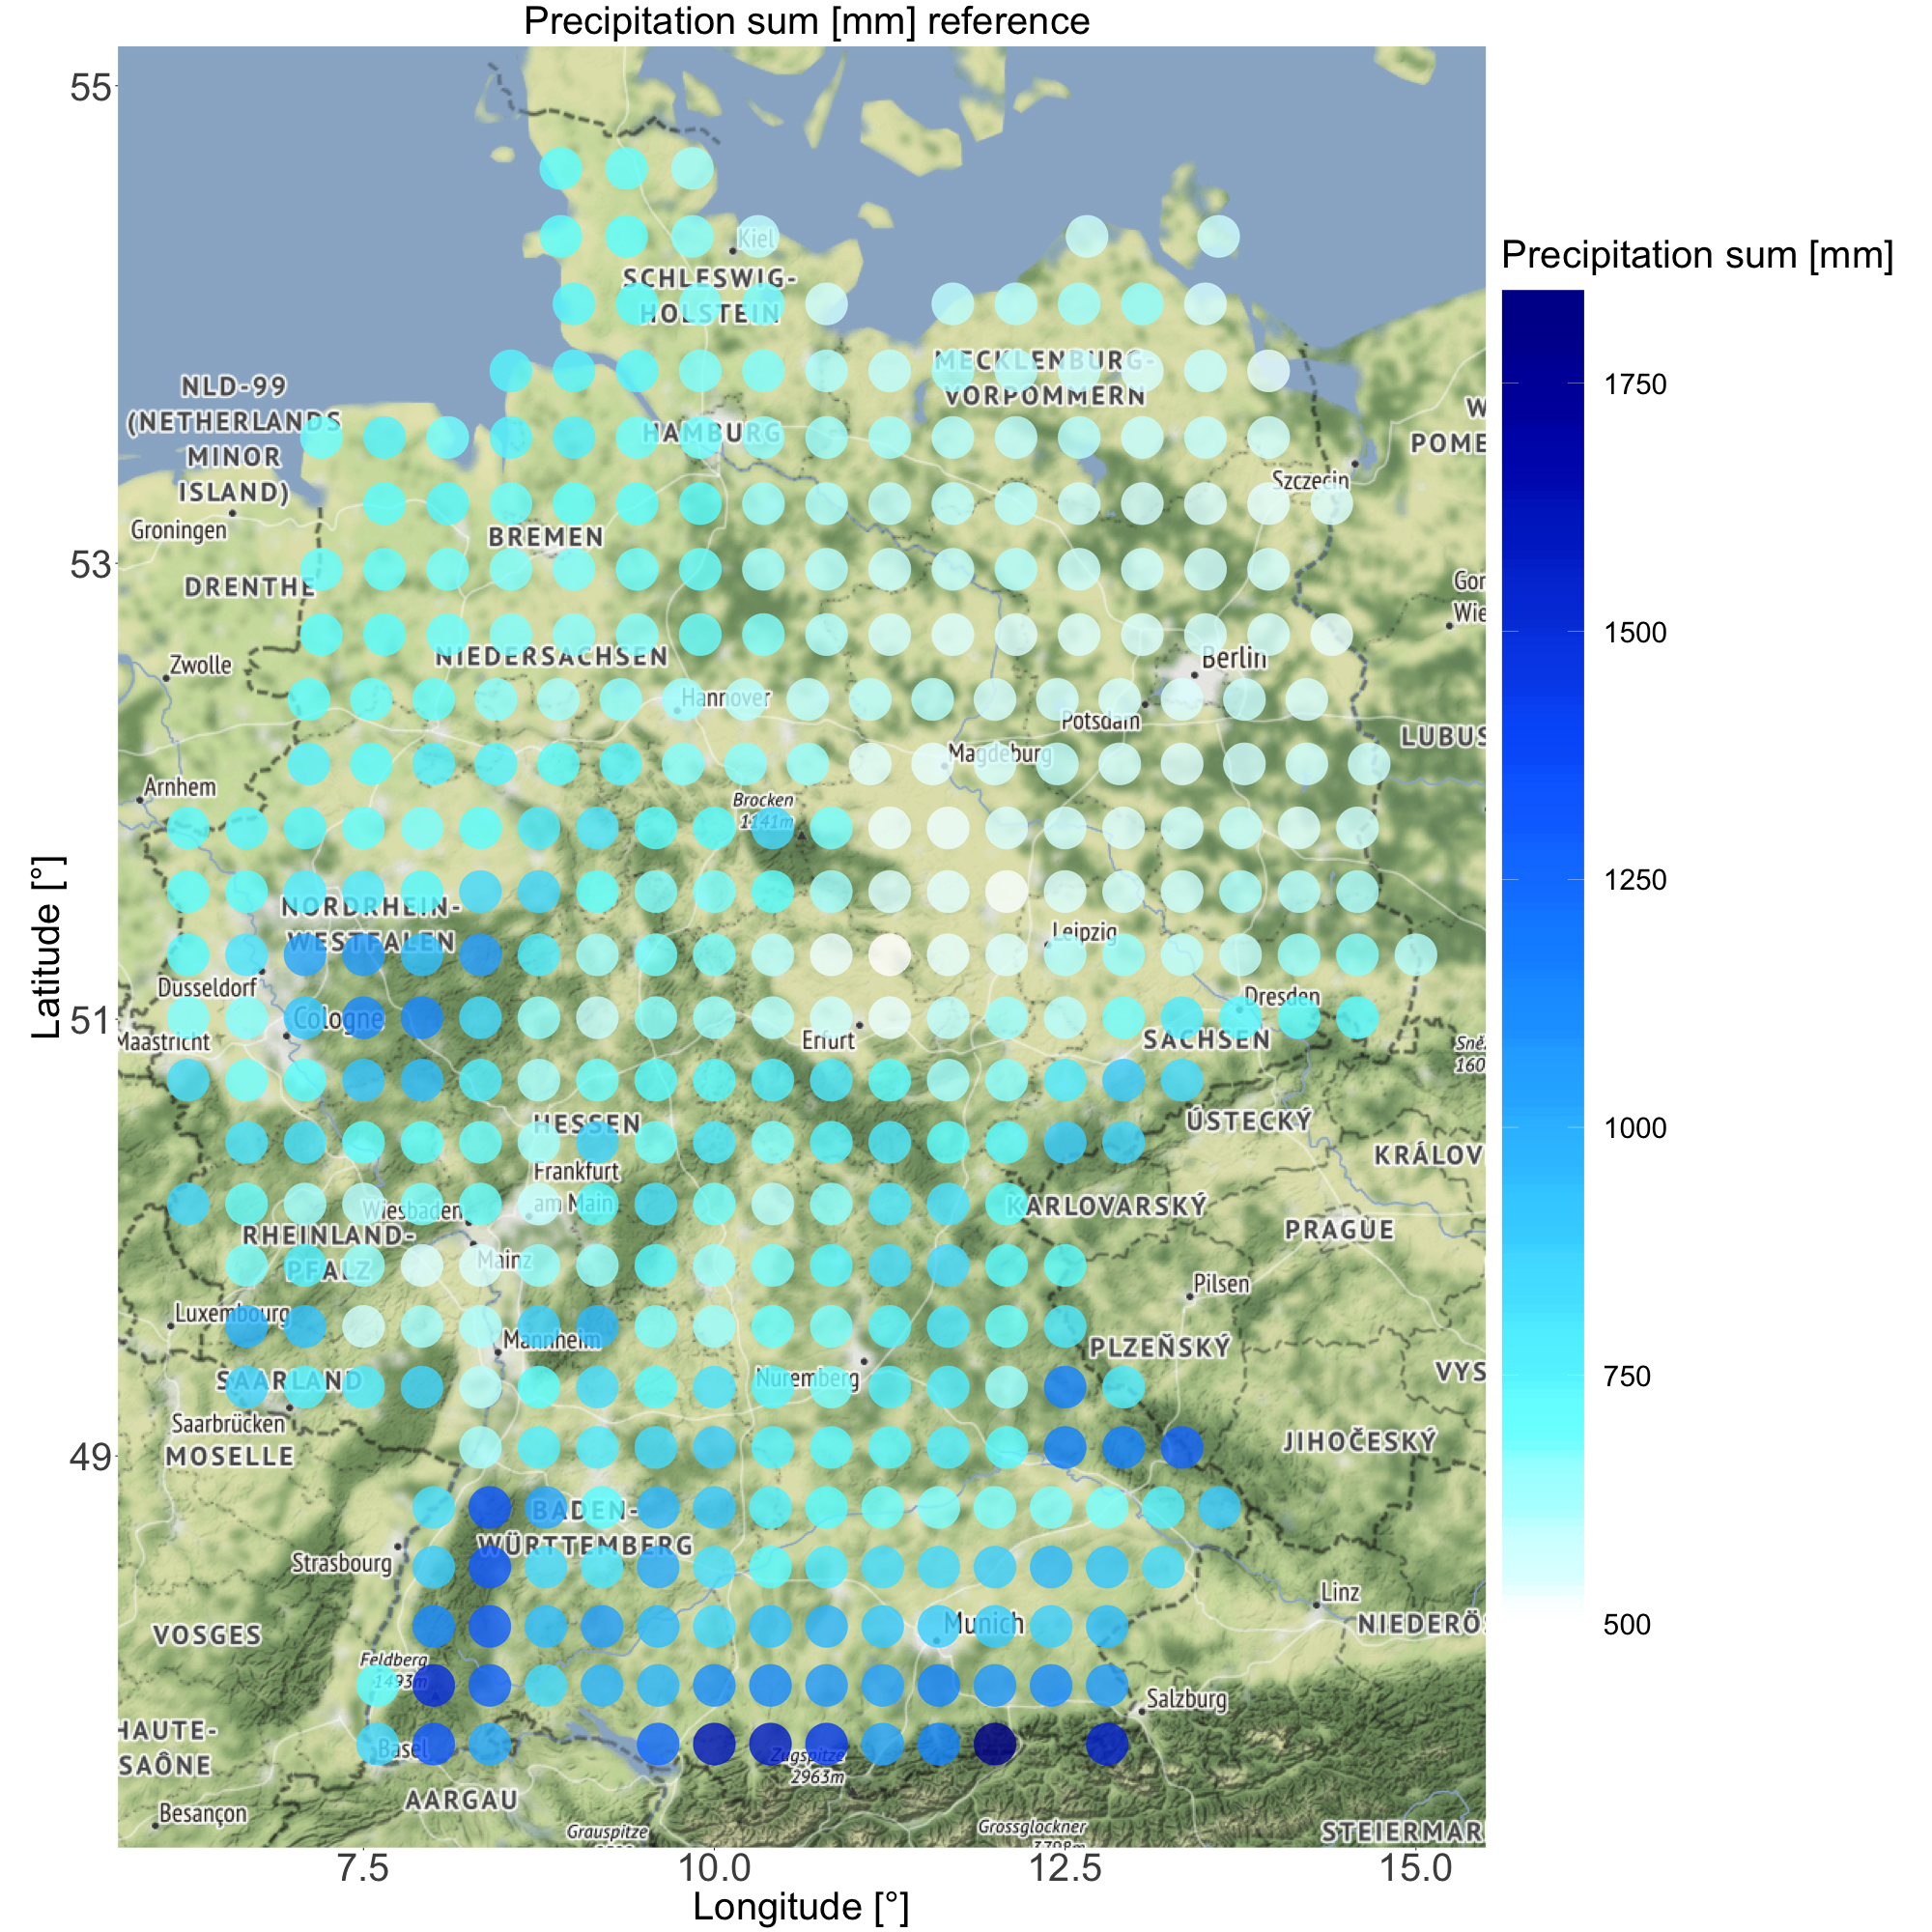
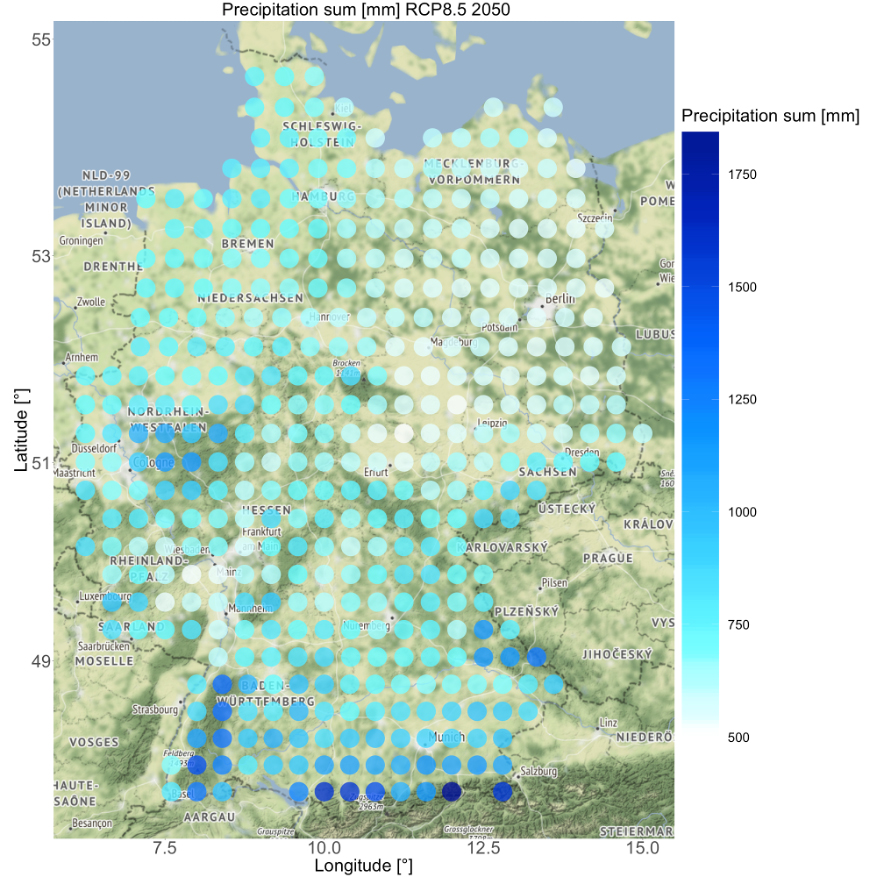
Figure 4: Average air temperature (°C) for the reference period (1979 – 2019) (upper left) and for the RCP8.5 emission scenario for the planning horizon 2050 (upper right). Yearly precipitation sum (mm) for the reference period (1979 – 2019) (lower left) and for the RCP8.5 emission scenario for the planning horizon 2050 (lower right).
Folder Structure
Yearly Aggregation
/output/yearly/temperature/variable/
/output/yearly/precipitation/variable/
/output/yearly/wind/variable/
Within the variable folder the following files are stored:
- yearly_locationID_variable.pdf
- yearly_locationID_variable.csv
An example of the yearly_Basel_heat_days.csv file can be downloaded here.
The number of rows within the file is defined by the number of chosen years in the reference period. In case of choosing the default reference period between 1979 and 2019, the file contains 41 rows, each row representing one year. The emission scenarios and time horizons are represented in the columns of the file (e.g. reference, RCP2.6 2035, RCP8.5 2085).
Within the yearly folder the following files are stored:
- yearly_locationID_summary.csv
The mean values for each emission scenario and time horizon of all available variables are summarized in this file. The rows are represented by the variable names, the columns are represented by the emission scenarios and time horizons.
Seasonal Aggregation
/output/seasonal/temperature/variable/
/output/seasonal/precipitation/variable/
/output/seasonal/wind/variable/
Within the variable folder the following files are stored 2. seasonal_RCP_locationID_variable.pdf 3. seasonal_RCP_locationID_variable.csv
An example of the seasonal_RCP85_Basel_heat_days.csv file can be downloaded here.
Monthly Aggregation
/output/monthly/temperature/variable/
/output/monthly/precipitation/variable/
/output/monthly/wind/variable/
Within the variable folder the following files are stored 4. monthly_RCP_locationID_variable.pdf 5. monthly_RCP_locationID_variable.csv
An example of the monthly_RCP85_Basel_heat_days.csv file can be downloaded here.
Data Manipulation
Climate Scenarios (CMIP5 Framework)
Representative Concentration Pathways (RCPs) published by IPCC lead to global climate scenarios, each representing an assumed radiative forcing in the year 2100. There are four different RCPs (RCP2.6, RCP4.5, RCP6.0 and RCP8.5) which describe different scenarios based on different radiative forcing. The RCP8.5 scenario, for example, describes a temperature increase of 4.8 degrees Celsius by 2100 compared to the pre-industrial conditions with the assumption of a radiative forcing of 8.5 W/m. RCP data were obtained from the fifth phase of the Coupled Model Intercomparison Project (CMIP5).
In this framework a large number of monthly climate projections on single levels were computed based on different experiments, models, members and time periods. CMIP5 data are used extensively in the Intergovernmental Panel on Climate Change Assessment Reports (the latest one is IPCC AR5, which was published in 2014).
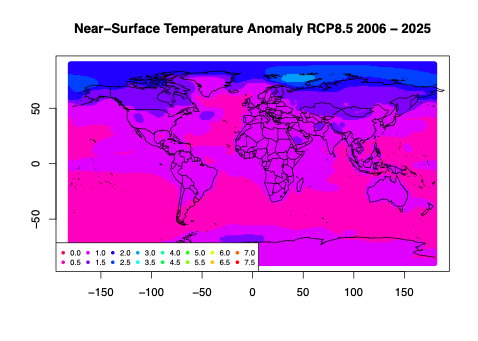
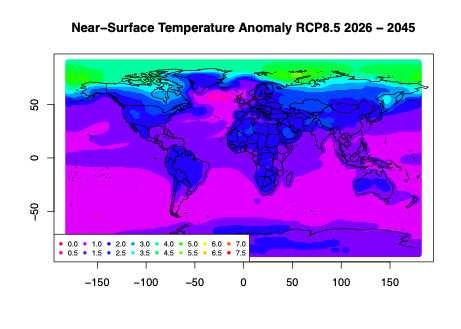
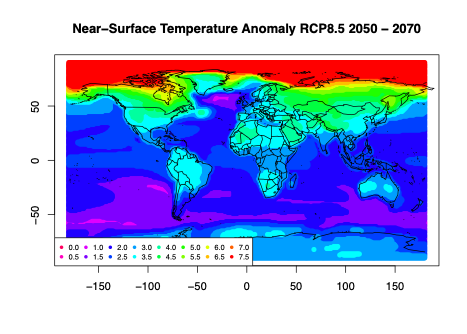

Figure 5: Near-Surface Temperature Anomaly RCP8.5 for four different time periods (2006 – 2025 upper left; 2026 – 2045 upper right; 2050 – 2070 lower left; 2075 – 2095 lower right).
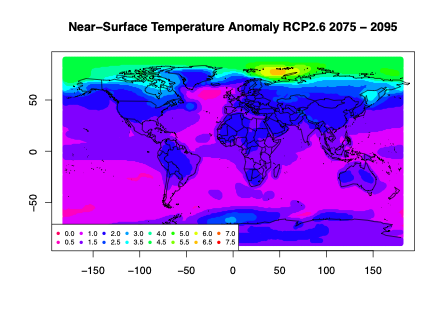
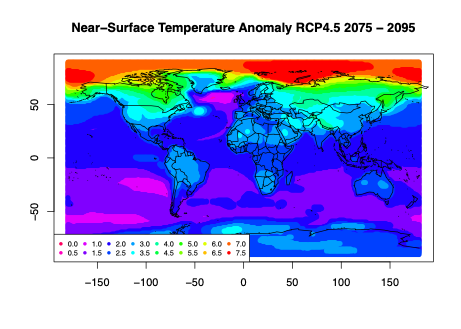
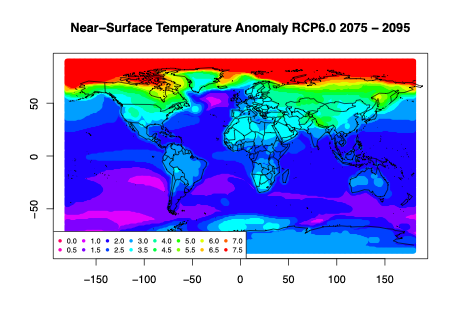
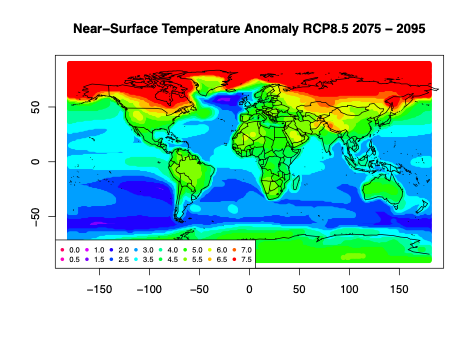
Figure 6: Near-Surface Temperature Anomaly for the time period 2075 – 2095 for four different emission scenarios (RCP2.6 upper left; RCP4.5 upper right; RCP6.0 lower left; RCP8.5 lower right).
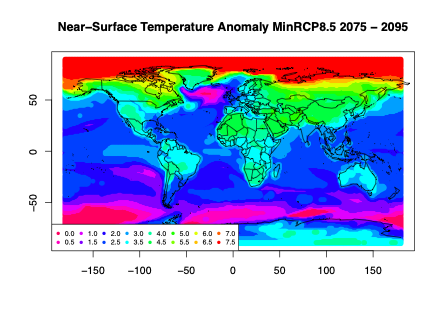
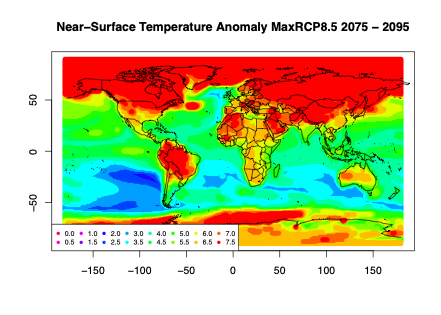
Figure 7: Near-Surface Temperature Anomaly for the time period 2075 – 2095 and the RCP8.5 emission scenario (ensemble minimum left; ensemble maximum right).
Depending on the chosen parameter up to 10 different member ensembles of each RCP scenario are available. For the near-surface air temperature e.g. the following member ensembles are calculated: canesm2, ccsm4, cesm1-cam5, cnrm-cm5, gfdl-cm3, hadgem2-es, miroc5, mpi-esm-mr, mri-cgcm3.
Each emission scenario is based on a baseline (reference) simulation (1850 – 2006) and a future simulation (2005 – 2099). Baseline simulation over more than 150 years are averaged over the entire baseline time period and climate change variables are calculated as follows:
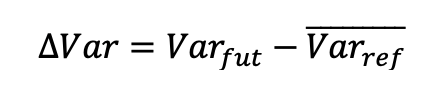
where ∆Var are the change of the variable with respect to the baseline simulation, Var(fut) are the projected future values of the variable and Var(ref) are the values of the variable in the baseline period.
The horizontal resolution of the climate change scenarios depends on the chosen variable, but typically is 1x1°, with a temporal resolution of one month.
Combining Climate Signal with ERA5 Reanalysis
The change in the specific variable ∆Var is a function of the year (2020 – 2100) and a function of the different emission scenarios (RCP2.6, RCP4.5, RCP6.0, RCP8.5). In order to estimate the values of different variables in the future, ∆Var is added to the reanalysis dataset ERA5, which is used as the reference period (1979 – 2019).
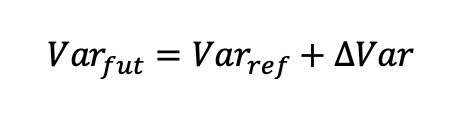
where Var(fut) is the variable in a future scenario, Var(ref) is the time series of the ERA5 dataset from 1979 – 2019 and ∆Var is the change in the variable for different future years and emission scenarios.