Datasets
The Dataset API for weather and environmental data combines different global datasets with data from different sources, variables, spatial and temporal resolution, reaching back to 1940. The dynamic web interface makes these datasets available with a few clicks for any location on Earth. This combination is a key advantage, as each dataset has its advantages and limitations. The interface also provides an API configuration tool, enabling combination of different datasets into single API calls. Data can thus be downloaded into other systems.
Datasets currently available in the meteoblue dataset API include
- weather simulation models
- weather reanalysis models
- satellite and other observational data for weather, vegetation and other variables
- topographic, land use and soil data
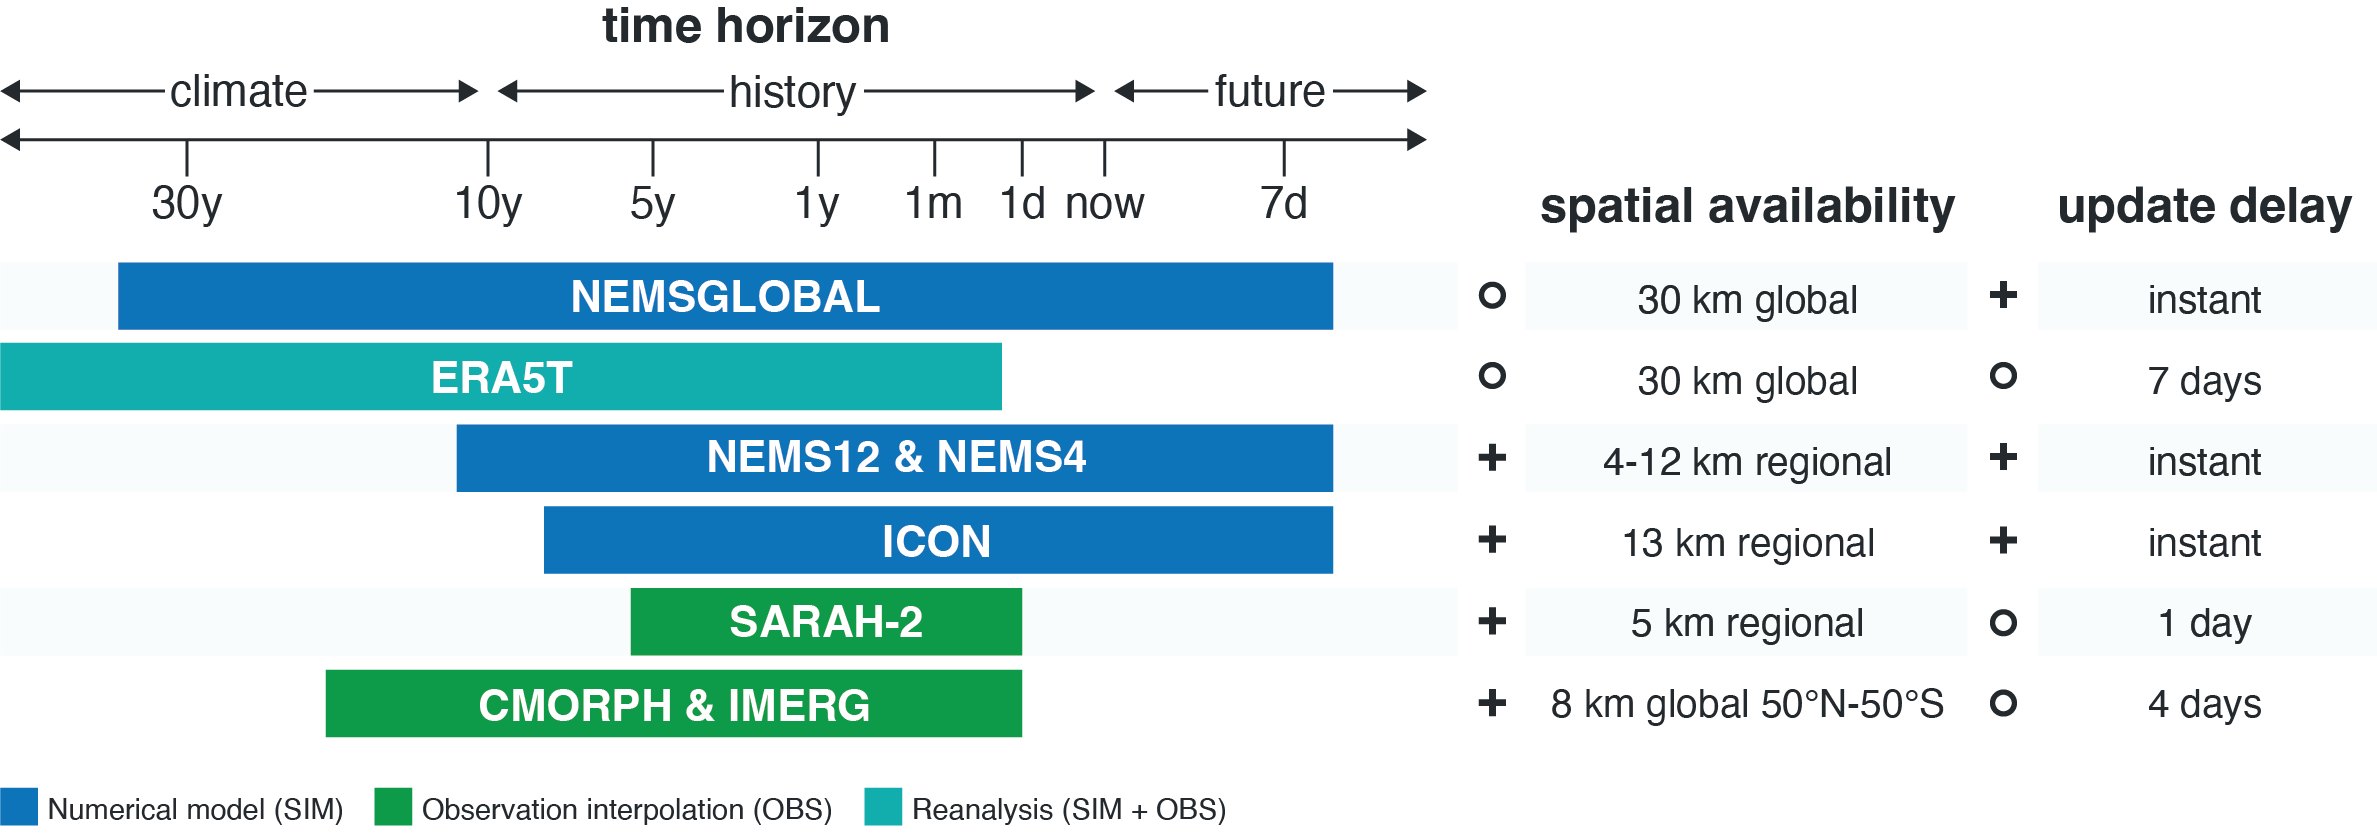
Global weather models (NEMSGLOBAL or ERA5) cover the entire Earth. Some global models have been operational and calculated since decades, and provide consistent data sequences over 10-30 years, in hourly to 3-hourly intervals. NEMSGLOBAL and ERA5 are the only models available in hourly intervals for more than 30 years. The high resolution weather (NEMS models are computed for single domains and therefore cover a certain region or continent and are not available globally like NEMSGLOBAL or ERA5. High resolution models (NEMS4, ICON7, etc.) are also only running since few years, and therefore their time series do not reach back for much longer than the year 2010. Most weather simulation datasets are automatically updated daily, which gives an instant availability of these datasets and underlines the consistency between weather forecast and history. The high-speed access through our dataset API allows to combine the advantages of the different datasets included.
Structure
The dataset API uses a sophisticated database structure, that allows the combination of reanalysis weather data (ERA5), weather simulation data (NEMS, ICON etc.) and observational data (IMERG, CMORPH, CHIRPS, METEOSAT etc.) with static datasets like soil or vegetation characteristics within a call of a few seconds. Furthermore, it enables complex analysis of single point time series or spatially for temporal aggregated data. If computation time exceeds a few seconds, job queues can be used to proceed. Thus, the key features can be summarized as follows:
- Global availability
- Hourly time resolution
- Multiple datasets
- Optimal spatial resolution
- Downscaling on local altitude
- Instant updates (without time lag)
- Documented accuracy
- Flexible data structure
- Compatibility of different datasets
- Multiple aggregation and extraction functionalities
- High speed interface
Which Weather Model Should I Use?
Depending on the time series needed, several models might not be available. The advantages and limitations of each weather model are explained in more detail in this chapter and the figures.
In order to choose which weather model to use, several criteria have to be considered:
- Temporal availability – Are real time updates required? Which time period is needed?
- Spatial availability – Are the locations covered by the spatial extent or the model?
- Accuracy – Which are the key variables? Are single events important or rather aggregations?
- Consistency – Especially important, when training machine learning models for forecast optimization or calculating derived variables
- Time resolution – Which temporal detail is suitable (hourly, daily, monthly resolution)?
- Spatial resolution – Is the spatial resolution sufficient to detect the weather phenomenon ?
- Data size – More data size leads to longer transmission time
For long time series of 10 or more years, the only consistent data series available are NEMSGLOBAL and ERA5. Both models have the same spatial (30 km) and temporal (1 h) resolution. ERA5 data have the advantage of being recalculated with local measurements, however this does not imply ubiquitous higher accuracy. Also, ERA5 data are only updated weeks to months after occurrence, whereas NEMSGLOBAL produce seamless datasets from 1984 to 7 days ahead. Model choice depends on use criteria. It is recommended to consider both models to get an estimate of the uncertainty by looking at the differences between the 2 models.
If the last 1-5 years are of interest, many more weather models are available at higher spatial resolution. In that case, as many models as possible should be looked at to get a better understanding of the uncertainty. If local measurements are available, some models might be discarded depending on their performance when compared to observations. Unfortunately, there are not many universal rules: The best model or model combination has to be evaluated on a case-by-case basis. Some general points:
-
Higher resolution does not mean higher accuracy. It mainly means more spatial detail. This is especially true for precipitation accuracy, which might decline at higher resolution below 5 km.
-
Use more than one model, especially for forecasting and risk assessment.
-
Extreme events, like storms, thunderstorms and very high winds, are very unpredictable and will not be accurately seen in the model data nor in ERA5 reanalysis.
-
Local microclimatic details, e.g. warmer climate on a south facing slope, cannot be reproduced.
-
Spatial and temporal aggregations show lower errors than hourly data at a specific location.
An overview of advantages and limitations of the different weather datasets is given in meteoblue dataset API.
Advantages and limitations of different weather datasets in meteoblue dataset API:
| ICON | NEMS30 | NEMS4 | CMORPH | CHIRPS2 | SARAH-2 | ERA5T | |
| Complete without gaps (30y) | no | yes | no | no | no | no | yes |
| Temporal availability | 2016 - now | 1985 - now | 2008 - now | 1998 - now | 1981 - now | 2018 - now | 1940 - now |
| Raw time resolution (h) | 3 | 1 | 1 | 1 | 24 | 1 | 1 |
| Update delay (d) | 0 | 0 | 0 | 3 | 6 - 7 | 1 | 7 |
| Spatial availability | global | global | Europe only | 60°N - 60°S | 50°N - 50°S | 65°N - 65°S / 65°W - 65°E | global |
| Spatial resolution (km) | 12 | 30 | 4 | 8 | 5 | 5 | 30 |
| Temperature accuracy | +++ | ++ | +++ | no | no | no | +++ |
| Precipitation accuracy | ++ | ++ | + | ++(+) | ++(+) | no | ++ |
| Wind accuracy | ++ | ++ | +++ | no | no | no | +++ |
| Radiation accuracy | ++ | ++ | ++ | no | no | ++++ | +++ |
| Consistency with forecast | yes | yes | yes | no | no | no | no |
| Physical modelling | yes | yes | yes | no | no | no | yes |
Numerical weather model (SIM) | best | ok | |||
Observation (OBS) | very good | limited | |||
Reanalysis (SIM + OBS) | good | very limited |
Availability of Weather Data
As stated above, the datasets have different availabilities. For the availability, we can differentiate three different dimensions:
-
Temporal availability (available time range)
-
Spatial availability (available region)
-
Update frequency (automated updates and delay)
Best model availability is obtained by NEMSGLOBAL, which is available for all time ranges since 1984 and updated automatically every day. This means it is available since 1 January 1984 until 7 days ahead. ERA5 is available since 1979, but has a delay in update of around 3 months. Other weather datasets are available differently for some years backwards to seven days in the future.
The figure below gives an overview for the most important datasets. For more detailed information the specification of each dataset is available in chapter 2.
Resolution of Static Datasets
Some datasets (especially land/surface characteristics) are available at very high resolutions. For these datasets, meteoblue computed lower resolution equivalents, that should be used if they are combined with lower resolution datasets. There is no benefit of using a 30 m cropland dataset instead of a 1 km cropland dataset in combination with a 10 km resolution weather model, as the weather information cannot be improved in any way in doing so. In fact, using the 30 m dataset will have major performance and storage issues if used on larger areas. The 30 m dataset will need approximately 1000 times more computing time and will require about 900 times more data storage while not producing more accurate results than the 1 km dataset.
meteoblue Weather Simulation
NEMS
| Field | Metadata |
|---|---|
| Name | NEMSGLOBAL |
| Short Name | NEMS-30 |
| Long Name | NOAA Environment Monitoring System |
| Version | 2, 2013 |
| Theme | Weather, forecast, model, global |
| Period of Time | 1984 - present |
| Frequency | Daily |
| Update timelag | < 24 hours |
| Time-resolution | Hourly |
| Spatial Type | Plate Carreé grid |
| Spatial extent | Global |
| Spatial resolution | 30 km (Lon: 0.3333°, Lat: 0.469°) |
| Coordinate system | WGS-84 |
| Earth model | WGS-84 |
| Publisher | meteoblue |
| Date First Published | 2013 |
| Detailed specification | Janjic, Z. I., 2003: A nonhydrostatic model based on a new approach. Meteor. Atmos. Phys., 82, 271–285, https://journals.ametsoc.org/doi/full/10.1175/WAF-D-14-00049.1 |
| Homepage URL | www.meteoblue.com |
| Security Classification | Proprietary |
| Access Level | Defined in contract |
| Licence | meteoblue |
Description: meteoblue computes a global weather forecast, as well as many high resolution local area models covering Europe, Africa, Asia, South-, Central- and North America. The NEMS model family are improved NMM successors (operational since 2013). NEMS is a multi-scale model (used from global down to local domains) and significantly improves cloud-development and precipitation forecast. The high resolution archives have up to 10 years of data and are the weather dataset for the recent years. By default, the high resolution is used for recent years and the lower resolution (35 km) based on an assimilation rerun of the global model for the remaining years down to 1984. Statistical processing is used to adjust for differences caused by the change in resolution
Available model domains of the NEMS model family:
| Name | Short Name | Region | Spatial Resolution | Time Intervals | Forecast Horizon |
|---|---|---|---|---|---|
| NEMS4 | NEMS4 | Central Europe | 4 km | 1h | 72h |
| NEMS12 | NEMS12 | Europe | 12 km | 1h | 168h |
| NEMS2-12 | NEMS12_E | Europe | 12 km | 1h | 168h |
| NEMS-8 | NEMSCAM | Central America | 12 km | 1h | 144h |
| NEMS12 | NEMSIN | India | 12 km | 1h | 168h |
| NEMS10 | NEMSSA | South America | 10 km | 1h | 168h |
| NEMS10 | NEMSAF01 | South Africa | 10 km | 1h | 144h |
| NEMS8 | NEMSNZ | New Zealand | 8 km | 1h | 144h |
| NEMS8 | NEMSAS02 | Japan East Asia | 8 km | 1h | 144h |
| NEMS30 | NEMSGLOBAL | Global | 30 km | 1h | 168h |
| NEMS2-30 | NEMSGLOBAL_E | Global | 30 km | 1h | 168h |
By default, the NEMS models are building up on the GFS assimilation data.
The NEMS2 / NEMS_E models, however, are building up on the ECMWF assimilation data. In most weather situations, there is hardly any difference between the datasets. Since the ECMWF assimilation data is available with an additional delay of 3 hours only, it's not taken as default although its preferable quality in certain situations.
NEMSAUTO
NEMSAUTO is the automatic delivery of the highest resolution meteoblue model available for any requested period of time and location. This domain can be selected in the historical archive interface, dataset API and the maps interface, and is implemented into the forecast API (for variables where no mLM is present) as well as the history API.
In the history API, for calls with time periods ranging from years where only global low resolution data is available till years where high resolution data is available too, the former low resolution data is BIAS-corrected towards the later high resolution data, for the variables where this is feasible.
In the historical archive interface as well as in the Dataset API, NEMSAUTO only delivers data from the highest resolution model available for any requested location - as no automatical gapfilling is applied, no data will be delivered for periods before introduction of the highest resolution model. For example, selecting Basel, NEMSAUTO will yield no data before 2008 because NEMS4 is not present.
For the Maps, NEMSAUTO chooses - depending on the zoom level - the locally most adequate model.
In the forecast API, for the weather variables, where no multimodel or mLM is in place, NEMSAUTO is the mechanism that provides the highest resolution model data depending on the selected location.
NMM
The regional NMM models are the first weather models from meteoblue (operational since 2007). They are highly optimised for complex terrain. NMM is a predecessor of NEMS.
An overview of all NMM domains is given in the table below. Beside the resolution all other Metadata refers to NEMSGLOBAL (see table above)
Available model domains of the NMM model family:
| Name | Short Name | Region | Spatial Resolution | Forecast Horizon |
|---|---|---|---|---|
| NMM4 | NMM4 | Central Europe | 4 km | 72h |
| NMM12 | NMM22 | Europe | 12 km | 168h |
| NMM18 | SA01 | South America | 18 km | 144h |
| NMM18 | AF01 | South Africa | 18 km | 144h |
| NMM18 | AS01 | Southeast Asia | 18 km | 144h |
Third Party Weather Simulations
Below is a list of all third party weather models in the meteoblue weather database. The first table contains all models that are being used for the forecast.
The second table lists all historical models that are in the database but are no longer being updated.
| Name | Alternative Name | Region | Spatial Resolution | Time intervals | Forecast Horizon |
|---|---|---|---|---|---|
| COSMO (Consortium for Small-scale Modeling) | |||||
| COSMO-5M | COSMO5M | Central Europe | 5 km | 1h | 72h |
| COSMO-2I | COSMO2I | Italy and the Alps | 2 km | 1h | 48h |
| DWD (Deutscher Wetterdienst) | |||||
| ICON | ICON13 | Global | 13 km | 3h | 180h |
| ICONEU | ICON7 | Europe | 7 km | 3h | 120h |
| ICOND2 | ICON2 | Germany and Alps | 2.2 km | 1h | 48h |
| ECMWF (European Centre for Medium-Range Weather Forecasts) | |||||
| IFS04 | ECMWF-IFS | Global | 30 km | 3h | 144h |
| AIFS025 | ECMWF-AIFS (beta phase) | Global | 28 km (0.25°) | 6h | 360h |
| Environment and Climate Change Canada | |||||
| GEM | GEM2 | North America | 2.5 km | 1h | 48h |
| GEM15 | Global | 15 km | 3h | 168h | |
| JMA (Japan Meteorological Agency) | |||||
| MSM5 | Japan | 5 km | 78h | 1h | |
| KNMI (Koninklijk Nederlands Meteorologisch Instituut) | |||||
| HARMONIE-AROME | HRMN5 | Central Europe | 5 km | 48h | 1h |
| Météo-France | |||||
| MFGLOBAL | ARPEGE40 | Global | 40 km | 3h | 96h |
| MFEU | ARPEGE11 | Europe | 11 km | 1h | 96h |
| MFFR | AROME2 | France | 2 km | 1h | 36h |
| NCAR (National Center for Atmospheric Research) | |||||
| WRFAMS-7 | WRFAMS | South America | 7 km | 1h | 168h |
| NOAA (National Oceanic and Atmospheric Administration) | |||||
| GFS05 | GFS22 | Global | 25 km | 3h | 180h |
| HRW-FV3-5 | FV3-5 | Alaska | 5 km | 1h | 60h |
| HRRR | US | 3 km | 18h | 1h | |
| NAM3 | North America | 3 km | 1h | 60h | |
| NAM5 | North America | 5 km | 1h | 60h | |
| NAM12 | North America | 12 km | 3h | 84h | |
| NBM | North America | 2.5 km | 3h | 180h | |
| UK Met Office | |||||
| UKMO-2 | UMGB | UK and France | 2 km | 3h | 120h |
| UKMO-10 | UMGLOBAL 10 | Global | 10 km | 3h | 144h |
Only available in the Dataset API
| Name | Short Name | Region | Spatial Resolution | Time intervals | Data availability |
|---|---|---|---|---|---|
| HIRLAM consortium (High Resolution Limited Area Model) | |||||
| HIRLAM EU 11km | HIREU11 | Europe | 11 km | 1h | From 10/15 to 07/20 |
| HIRLAM EU 7km | HIREU7 | Europe | 7 km | 1h | From 03/19 to 11/22 |
| UK Met Office | |||||
| UKMO-17 | UMGLOBAL 17 | Global | 17 km | 3h | From 12/18 to 05/22 |
For raw data deliveries, meteoblue offers all 3-hourly datasets interpolated to hourly resolution too. In the meteoblue Weather Maps, only the original resolutions are available. meteoblue conducts no further postprocessings on third party models.
GEM, GEM15
GEM is a North American model run by the Canadian national weather service in 2.5 km resolution. GEM15 is a global model of the same operator, with a resolution of 15 km. More information is provided by Government of Canada.
COSMO-5M, COSMO-2I
The models COSMO-5M and COSMO-2I are two models of the Consortium for Small-scale Modelling. They each cover two areas in Europe (the Alps and Italy on the one hand and Central Europe on the other). The models are available in the MultiModels. Further information is provided by COSMO.
ICON, ICONEU, ICOND2
| Field | Metadata |
|---|---|
| Name | ICON ICONEU ICOND2 |
| Short Name | ICON13 ICON7 ICON2 |
| Long Name | Icosahedral Nonhydrostatic Model |
| Version | 1 |
| Theme | Weather, forecast, model, global |
| Period of Time | 2017 - present |
| Frequency | Daily |
| Update timelag | < 24 hours |
| Time-resolution | Hourly |
| Spatial Type | Irregular, unstructured icosahedral based triangular mesh |
| Spatial extent | ICON: Global ICONEU: Europe ICOND2: Germany and Alps |
| Spatial resolution | ICON: 13 km, every point represents a triangular area of 173 km ICONEU: 7 km ICOND2: 2.2 km |
| Coordinate system | WGS-84 |
| Earth model | WGS-84 |
| Publisher | DWD (German Weather Service) |
| Date First Published | 2017 |
| Detailed specification | DWD |
| Homepage URL | DWD |
| Security Classification | Public |
| Licence | Bundesamt für Kartographie und Geodäsie |
Description: The most important prognostic variables of ICON are air density and virtual potential temperature (which allows diagnosing the pressure), horizontal and vertical wind speed, humidity, cloud water, cloud ice, rain, and snow. These variables are calculated for all grid cells on 90 terrain-following model levels extending from the surface to a height of 75 km, yielding a total of about 265 million grid points. Over land, additional prognostic equations are solved for soil temperature and soil water content for 7 soil levels. If a snow cover is present, snow water equivalent and snow density are predicted in addition. The sea surface temperature over ice-free ocean surfaces is analyzed once per day from observations and is kept constant during the ICON forecast. For ice-covered parts of the oceans, the sea ice fraction is analyzed once per day from observations, whereas the ice thickness and the ice surface temperature are predicted with a simple sea-ice model. Besides horizontal and vertical transport processes (so-called adiabatic processes) in the atmosphere, diabatic processes like radiation, turbulence, formation of clouds, and precipitation play a major role for NWP. Describing these processes taking place on much smaller horizontal scales than the model mesh size is the task of the physics parameterizations.
Access Level : open data - may be re-used without any restrictions provided that the source reference is indicated, as laid down in the GeoNutzV ordinance ("Verordnung zur Festlegung der Nutzungsbestimmungen für die Bereitstellung von Geodaten des Bundes = Ordinance to Determine the Conditions for Use for the Provision of Spatial Data of the Federation). As to the layout of source references, the DWD requests adherence to the following guidelines (cf. § 7 of the DWD Law and § 3 of the GeoNutzV ordinance): The obligation to indicate the enclosed source references shall apply to any spatial data and other services of the DWD that are used without alteration. Source references must also be indicated even if extracts or excerpts are used or if the data format has been changed. Displaying the DWD logo shall be considered as meeting the requirement of source reference in meaning of the GeoNutzV ordinance. In the event of more advanced alteration, processing, new design or other adaptation, DWD at least expects to be mentioned in a central list of references or in an imprint. Indication of alteration according to the GeoNutzV ordinance may read as follows: "Data basis: Deutscher Wetterdienst, gridded data reproduced graphically"; "Data basis: Deutscher Wetterdienst, averaged over individual values", or "Data basis: Deutscher Wetterdienst, own elements added". If a service provided by the DWD is used in a way that does not comply with its intended purpose, the enclosed source references have to be deleted. This shall especially apply to weather warnings for which there is no guarantee that they are delivered to all users at all times completely and without delay.
IFS04
| Field | Metadata |
|---|---|
| Name | IFS |
| Short Name | ECMWF-IFS04 |
| Long Name | Integrated Forecast System |
| Version | 4 |
| Theme | Weather, forecast, model, global |
| Period of Time | 02/2022 - present |
| Frequency | Daily |
| Update timelag | < 24 hours |
| Time-resolution | Hourly |
| Spatial Type | Plate Carreé Grid |
| Spatial extent | global |
| Spatial resolution | 30km |
| Coordinate system | WGS-84 |
| Earth model | WGS-84 |
| Publisher | ECMWF (European Centre for Medium-Range Weather Forecasts) |
| Date First Published | 2022 |
| Detailed specification | ECMWF |
| Homepage URL | ECMWF |
| Security Classification | Public |
| Licence | CC-4.0-BY |
AIFS025
The Artificial Intelligence Forecasting System (AIFS) is in its beta phase, and is an innovative approach to enhance weather prediction using artificial intelligence and machine learning techniques. The AIFS is built up with a deterministic experimental model (forecasts are produced four times per day 00/06/12/18h UTC) and a probabilistic experimental model (ensemble model produced two times per day 00/12h UTC). Experimental runs are made available by ECMWF.
MSM5
The Meso-Scale Model (MSM5) is the weather model of the Japanese National Meteorological Service with a resolution of 5 km and covers Japan and surrounding areas. Further information is provided by theJapan Meteorological Agency.
HARMONIE-AROME
The HRMN5 model of the Dutch National Meteorological Service (KNMI) covers large parts of Central Europe with a resolution of 5km. More information is provided byKNMI.
MFGLOBAL, MFEU, MFFR
MF is the abbreviation for Meteofrance that is the French national weather service. They run the ARPEGE model for the whole world in 40 km resolution (ARPEGE40 = MFGLOBAL) and for the European continent in 11 km resolution (ARPEGE11 = MFEU). Furthermore, Meteofrance provides a high-resolution model with 2km gird size for France (AROME2 = MFFR). More information can be found on the page of Météo-France and Centre National de Recherches Météorologiques.
GFS05
GFS is the global forecasting system of the U.S. weather service NOAA. The model has been updated from a previous resolution of 40 km to the current resolution of 25 km. Further information is provided by NOAA.
HRW-FV3-5
The HRW-FV3-5 is a high resolution model for Alaska. "The High Resolution Window (HRW) contains forecast images from both the Weather Research and Forecasting (WRF) Advanced Research WRF (ARW) model and the Nonhydrostatic Multiscale Model on B-grid (FV3)." (Source: NOAA). More information about FV3 is provided by National Weather Service. A model guidance from NOAA can be found here.
HRRR
"The HRRR is a NOAA real-time 3-km resolution, hourly updated, cloud-resolving, convection-allowing atmospheric model, initialized by 3km grids with 3km radar assimilation." (source: NOAA)
NAM3, NAM5, NAM12
The NAM (North American Forecast System) family of models was developed by the National Centers for Environmental Prediction. NAM models generate various grid cells across North America using the same algorithms as the meteoblue NEMS model domains. More information is provided by NOAA and the model guidance.
NBM
The NBM (National Blend of Models) is a combination of different models for the purpose of a more accurate prediction. NWS (national weather service) and non-NWS numerical weather prediction model data and post-processed model guidance are used, so that a better result can be achieved. Further information is provided by National Wetaher Service.
UKMO-2, UKMO-10, UKMO-17
UKMO-2 and UKMO-10 are two models of the atmosphere that are run by the British Meteorology Office (UKMO). There is an older global model UKMO-17 that is available in the meteoblue dataset API and has a resolution of 17 km. UKMO-2 is a model that covers Great Britain and Benelux completely and parts of Norway, Sweden, France and Germany. It has a resolution of 2 km. UKMO-10 is a global model and has a resolution of 10 km. Further information is offered by the Metoffice, about: Unified Model and Numerical weather prediction models.
HIRLAM EU 7km, HIRLAM EU 11km
HIREU7 and HIREU11 (HIRLAM EU 7 km and HIRLAM EU 11 km, High Resolution Limited Area Model) are two models for Europe, run by the HIRLAM consortium (10, mostly North European weather services). HIREU11 is available from 10/2015 till 06/2020 (deprecated), HIREU7 from 03/2019 till present. The original project website is no longer online, but more information is available from the Finish Meteorological Institute.
WRFAMS-7
The WRFAMS (Weather Research and Forecasting Model for South America) is a state of the art mesoscale numerical weather prediction system and will significantly improve local forecasting for South America, with a focus on wind data. Added to the mLM, which combines dozens of different numerical weather models with nowcasting data and high-resolution 30x30 meter topography models, it will help in achieving higher levels of accuracy in South America through post-processing. More information is provided by the National Center for Atmospheric Research.
Seasonal Forecasts
Seasonal Anomalies Forecast Models
| Model Name | Model system (official name) | Source | Remarks |
|---|---|---|---|
| SA-ENSEMBLE | meteoblue | The ensemble mean computed from all the seasonal forecast models listed. In general, this super-ensemble is more likely correct than any individual model system | |
| SA-ECMWF | SEAS-5 | European Center for Medium range Weather Forecast (ECMWF) | This model also provides the mean monthly climate reference to which the ECMWF seasonal anomaly may be applied to |
| SA-JMA | CPS-2 | Japan Meteorological Agency (JMA) | While the data only is available with a 2.5 degree resolution, the computations are done with an interpolated resolution of 100km |
| SA-UKMO | HadGEM3-GC2.0 | UK MetOffice | |
| SA-METEOFR | System7-v20190301 | MeteoFrance | |
| SA-DWD | GCFS2.1-v20200320 | Deutscher Wetterdienst (DWD) | |
| SA-NCEP | CFSv2-v20110310 | US National Center of Environmental Prediction (NOAA) | |
| SA-CMCC | CMCC-CM2-v20191201 / SPS3.5 | Centro Euro-Mediterraneo sui Cambiamenti Climatici (CMCC) |
CFS
| Field | Metadata |
|---|---|
| Name | CFS |
| Long Name | Climate Forecast System |
| Theme | long term forecast, climate, anomalies |
| Period of Time | Current month plus five upcoming months (there is no archive) |
| Frequency | Few times in a month |
| Time-resolution | Monthly |
| Spatial Type | Plate Carreé grid |
| Spatial extent | Global |
| Spatial resolution | 100 km |
| Coordinate system | WGS-84 |
| Earth model | WGS-84 |
| Publisher | NOAA |
| Date First Published | 2019 |
| Detailed specification | https://cfs.ncep.noaa.gov/ |
| Homepage URL | https://cfs.ncep.noaa.gov/ |
| Security Classification | Public |
| Access Level | Link |
| Licence | Public |
Description The seasonal forecast provides climate characteristics such as mean values or anomalies for an entire month. Anomalies are deviations from the climatological mean. Thus, a negative temperature and precipitation anomaly indicates cooler and drier than average conditions. The dataset does not allow the prediction of the weather at a specific day, but rather describes a trend over a whole month.
Weather & Climate Reanalysis
ERA5, ERA5T
| Field | Metadata |
|---|---|
| Name | ERA5 ERA5T |
| Long Name | ECMWF Reanalysis 5th Generation |
| Version | 5 |
| Theme | Weather, climate, reanalysis, model |
| Period of Time | ERA5: 1979 - 10/2022 ERA5T: 1940 - present |
| Frequency | ERA5: Monthly ERA5T: Weekly |
| Update timelag | ERA5: 12 weeks ERA5T: 1 week |
| Time-resolution | Hourly |
| Spatial Type | ERA5: ECMWF reduced Gaussian Grid N320 ERA5T: ECMWF linear grid TL639 |
| Spatial extent | Global, 180°W to 180°E / 89.784°S to 89.784°N |
| Spatial resolution | 30 km |
| Coordinate system | WGS-84 |
| Earth model | WGS-84 |
| Publisher | ECMWF |
| Date First Published | 2013 |
| Detailed specification | https://confluence.ecmwf.int/display/CKB/ERA5%3A+data+documentation and https://cds.climate.copernicus.eu/cdsapp#!/dataset/reanalysis-era5-single-levels?tab=overview |
| Homepage URL | https://confluence.ecmwf.int/display/CKB/ERA5%3A+data+documentation |
| Security Classification | Public |
| Licence | https://apps.ecmwf.int/datasets/licences/copernicus/ |
Description: ERA5 was produced using 4DVar data assimilation in CY41R2 of ECMWF’s Integrated Forecast System (IFS), with 137 hybrid sigma/pressure (model) levels in the vertical, with the top level at 0.01 hPa. Atmospheric data are available on these levels and they are also interpolated to 37 pressure, 16 potential temperature and 1 potential vorticity level(s). "Surface or single level" data are also available, containing 2D parameters such as precipitation, 2m temperature, top of atmosphere radiation and vertical integrals over the entire atmosphere. The IFS is coupled to a soil model, the parameters of which are also designated as surface parameters, and an ocean wave model. Improvements to ERA5, compared to ERA-Interim, include 30 km instead of 80 km spatial resolution, 1h time resolution, use of HadISST.2, reprocessed ECMWF climate data records (CDR), and implementation of RTTOV11 radiative transfer. Variational bias corrections have not only been applied to satellite radiances, but also ozone retrievals, aircraft observations, surface pressure, and radiosonde profiles.
Important notes:
- Precipitation events with less than 0.1 mm per hour are filtered out of the dataset, as they are numerical artefacts leading to a huge overestimation of rainfall hours.
- Due to the absence of satellite observations prior to 1980, the ERA5T data from 1940 to 1980 has a lower accuracy compared to the data from 1980 onwards.
- For further known (accuracy) issues with the ERA5 / ERA5T datasets, please consult the offical ERA5 product page of ECMWF here.
ERA5 and ERA5T offer static information about the soil texture type and its properties:
| Type | Soil moisture at saturation | Field capacity | Permanent wilting point | Residual moisture | |
|---|---|---|---|---|---|
| 1 | Coarse | 0.403 | 0.244 | 0.059 | 0.025 |
| 2 | Medium | 0.439 | 0.347 | 0.151 | 0.010 |
| 3 | Medium fine | 0.430 | 0.383 | 0.133 | 0.010 |
| 4 | Fine | 0.520 | 0.448 | 0.279 | 0.010 |
| 5 | Very fine | 0.614 | 0.541 | 0.335 | 0.010 |
| 6 | Organic | 0.766 | 0.663 | 0.267 | 0.010 |
| 7 | Tropical organic | 0.472 | 0.323 | 0.171 | - |
Access Level: This Licence is free of charge, worldwide, non-exclusive, royalty free and perpetual. Access to Copernicus Products is given for the purpose of the following use in so far as it is lawful: reproduction; distribution; communication to the public; adaptation, modification and combination with other data and information; or any combination of the foregoing.
For a more detailed description of the ERA5 reanalysis datasets, see here.
As ERA5 only is available with a delay of several months, it currently is being replaced with ERA5T, which only has a delay of 1 week (and is expected to be updated daily in the future). ERA5 is planned to be deprecated at some point. Differences in the data occur due to the different projections, which also results in a slightly higher (interpolated) resolution of the ERA5T dataset.
Gridmet
| Field | Metadata |
|---|---|
| Name | gridMET Metgrid METDATA |
| Version | 1 |
| Theme | Weather, climate, reanalysis, model, U.S.A. |
| Period of Time | 1979 - present |
| Frequency | Daily |
| Update timelag | 1 day, but data for dates within the last 60 days are considered preliminary and subject to change. |
| Time-resolution | Daily |
| Spatial extent | U.S.A. |
| Spatial resolution | ~4-km |
| Coordinate system | WGS-84 |
| Earth model | WGS-84 |
| Publisher | University of California Merced |
| Date First Published | 2012 |
| Detailed specification | RMetS |
| Homepage URL | https://www.climatologylab.org/gridmet.html |
| Security Classification | Public |
| Licence | https://creativecommons.org/publicdomain/zero/1.0/ |
"gridMET is a dataset of daily high-spatial resolution (~4-km, 1/24th degree) surface meteorological data covering the contiguous US from 1979-yesterday." (source: Climatology Lab). The dataset uses the high-resolution spatial data from PRISM and combines it with the high-resolution temporal data from the National Land Data Assimilation System (NLDAS) to create spatially and temporally continuous fields suitable for additional land surface modelling.
The primary climate variables covered are:
- Maximum Temperature
- Minimum Temperature
- Downward surface shortwave radiation
- Wind-velocity
- Humidity (maximum and minimum relative humidity)
- Specific humidity
Additionally, the following derived variables are featured:
- Reference evapotranspiration (ASCE Penman-Monteith)
- Energy Release Component *
- Burning Index *
- 100-hour and 1000-hour dead fuel moisture
- Mean vapor pressure deficit
- 10-day Palmer Drought Severity Index
- Fuel model G (conifer forest)
SILO (AWAP)
| Field | Metadata |
|---|---|
| Name | SILO |
| Long Name | Scientific Information of Land Owners |
| Version | 1.0 |
| Theme | Australia, climatology, precipitation, temperature, radiation |
| Period of Time | 1950 - present (depending on variable) |
| Frequency | Daily |
| Update timelag | < 24 hours |
| Time-resolution | Daily |
| Spatial Type | Plate Carreé Grid |
| Spatial extent | Australia, 112°W to 154°E / 44°S to 10°S |
| Spatial resolution | 15 km (interpolated to 0.05°) |
| Coordinate system | WGS-84 |
| Earth model | WGS-84 |
| Publisher | Queensland Government (Department of the Environment, Tourism, Science and Innovation) |
| Date First Published | 2017 |
| Detailed specification | SILO |
| Homepage URL | SILO |
| Security Classification | Public |
| Licence | https://creativecommons.org/licenses/by/4.0/ |
Description: SILO is a Queensland Government database providing continuous daily climate data for Australia from 1889 to the present, in formats suitable for modelling and research. The data consist of daily gridded climate values derived from Bureau of Meteorology ADAM observations, with missing values filled by interpolation (kriging) at a resolution of 0.05° (~5 km). In total, the dataset covers approximately 280,000 points across Australia and nearby islands. Because the gridded data are generated from spatial interpolation of station observations, resolution can be lower in some regions, with effective spacing reaching hundreds of kilometers. meteoblue provides a subset of the data starting from 1950, leaving it otherwise unmodified (e.g., no filling of data gaps) to maintain its official character.
Access Level: Available under Creative Commons Attribution 4.0 International (CC BY 4.0), allowing free use with appropriate credit, a link to the licence, and indication of any changes.
BOM
| Field | Metadata |
|---|---|
| Name | BOM |
| Long Name | Australian Bureau of Meteorology (BOM) historic gridded climate data |
| Version | 1 |
| Theme | Australia, climatology, precipitation, temperature, radiation, BOM |
| Period of Time | 1901 - June 2021 (depending on variable) |
| Frequency | Daily |
| Update timelag | < 24 hours |
| Time-resolution | Daily |
| Spatial Type | Plate Carreé Grid |
| Spatial extent | Australia, 112°W to 156°E / 44.5°S to 10°S (origin: 112.0°W / 44.5°S) |
| Spatial resolution | 15 km (interpolated to 0.05°) |
| Coordinate system | WGS-84 |
| Earth model | WGS-84 |
| Publisher | Australian Bureau of Meteorology (BOM) |
| Date First Published | November 2017 |
| Detailed specification | BOM |
| Homepage URL | BOM |
| Security Classification | Public |
| Licence | https://creativecommons.org/licenses/by/3.0/au/ |
Description: The BOM provides daily gridded climate data as interpolated observational data at a resolution of 0.05 degrees (approximately 5 km) covering entire Australia.
The following variables are available from BOM (and also incorporated into the meteoblue system):
- Daily rainfall gridded data (daily precipitation sum) (from 1901 until present.)
- Daily gridded temperature data for the period (max/min temperatures) (from 1911 until present)
- Daily vapour pressure grids (daily 9am and 3pm) (1971 to present)
- Daily total gridded global solar exposure data (1990 to present)
The data is gridded at a resolution of 0.05 degrees, however the information content is nowhere near this localized. The data was obtained by spatial interpolation of station observations and thus has resolutions as bad as hundreds of kilometers in certain areas. meteoblue will not alter the content of the original dataset (e.g. fill data gaps) in order to preserve the official character of the dataset.
Access Level: Creative Commons Attribution 3.0 Australia (CC BY 3.0 AU) and can be freely used. You must give appropriate credit, provide a link to the licence, and indicate if changes were made.
Tropical Storms
Using the observed tracks data (ibtracs version 4) we run a hurricane wind speed model to compute the spatio temporal wind impact of the storms. We modelled all hurricanes and tropical storms for North and Central Amercia since 1950. Major Atlantic hurricanes go back to 1940.
For reanalysis purposes:
- Tropical Storms (US) - Data available until 2021.
- Tropical Storms (Indian Pacific) - Data available until 2019.
These datasets are deprecated and therefore no longer stored in our Dataset API.
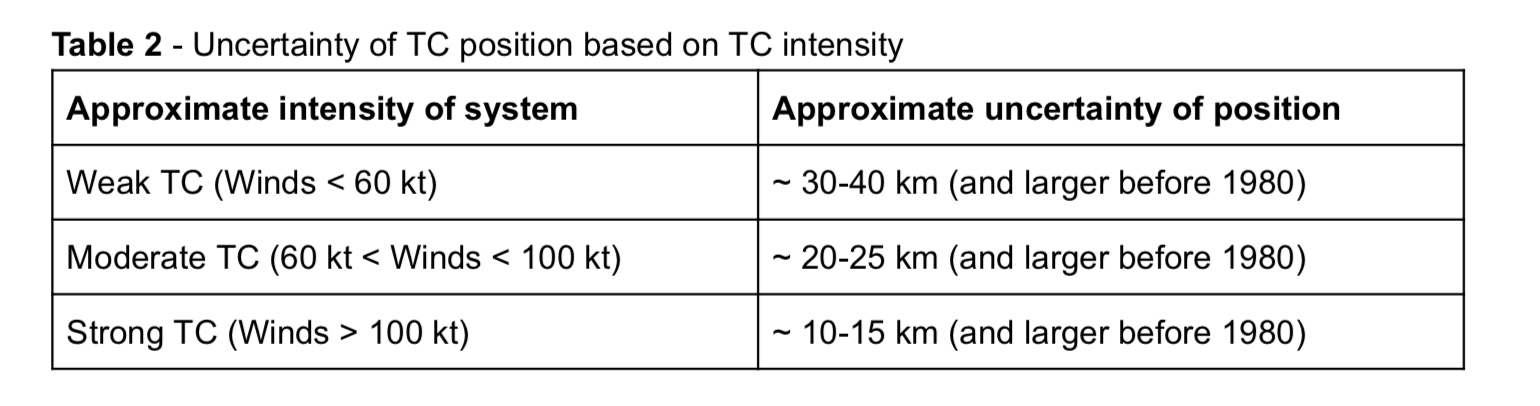
The dataset has 20 km spatial resolution (which is more than enough for such large systems, especially considering the uncertainties in observed tracks data shown in Table 2) and 1 hour temporal resolution. It contains the wind speed due to tropical storms. It does not contain any other winds for which there is already a multitude of datasets, thus most of the time the wind speed will be 0 or NaN. The hurricane wind speed model does consider landfall, the relative movement of the storm leading to an assymetric wind field, the eye and other physical characteristics of a hurricane.
Important information for dataset usage: The maximum sustained wind speeds for tropical cyclones are the highest surface winds occurring within the circulation of the system. meteoblue stores these as gust winds at 10m above ground level. These "surface" winds are those observed (or, more often, estimated) to occur at the standard meteorological height of 10 m in an unobstructed exposure (i.e., not blocked by buildings or trees). The U.S. agencies (NOAA and JTWC) report a 1 min averaging time for the sustained (i.e. relatively long-lasting) winds. In most of the rest of the world, a 10 min averaging time is used for "sustained wind". It is possible to convert from peak 10 min wind to peak 1 min wind (roughly 12% higher for the latter) as a general rule. meteoblue did not make any conversions regarding the averaging period, so as to keep the data as close to the original observations as possible.
Some applications may require to get hurricane gust winds lasting only a few seconds. This can be achieved by a simple multiplication of the gust wind speed stored in our database depending on the distance to the sea. Here is a table with gust factors based on location (Harper, Kepert, and Ginger 2010):
| Location | Gust factor (G3, 60) |
|---|---|
| In-land | 1.49 |
| Just offshore | 1.36 |
| Just onshore | 1.23 |
| At sea | 1.11 |
Note that measuring hurricane wind speed is extremely difficult and requires proxies like satellite data, therefore the uncertainty in estimated wind speeds is dependent on the year and ocean basin.
SI, NI = Southern, Northern Indian Ocean; SP, WP, EP = Southern, Western, Eastern Pacific; NA = North Atlantic
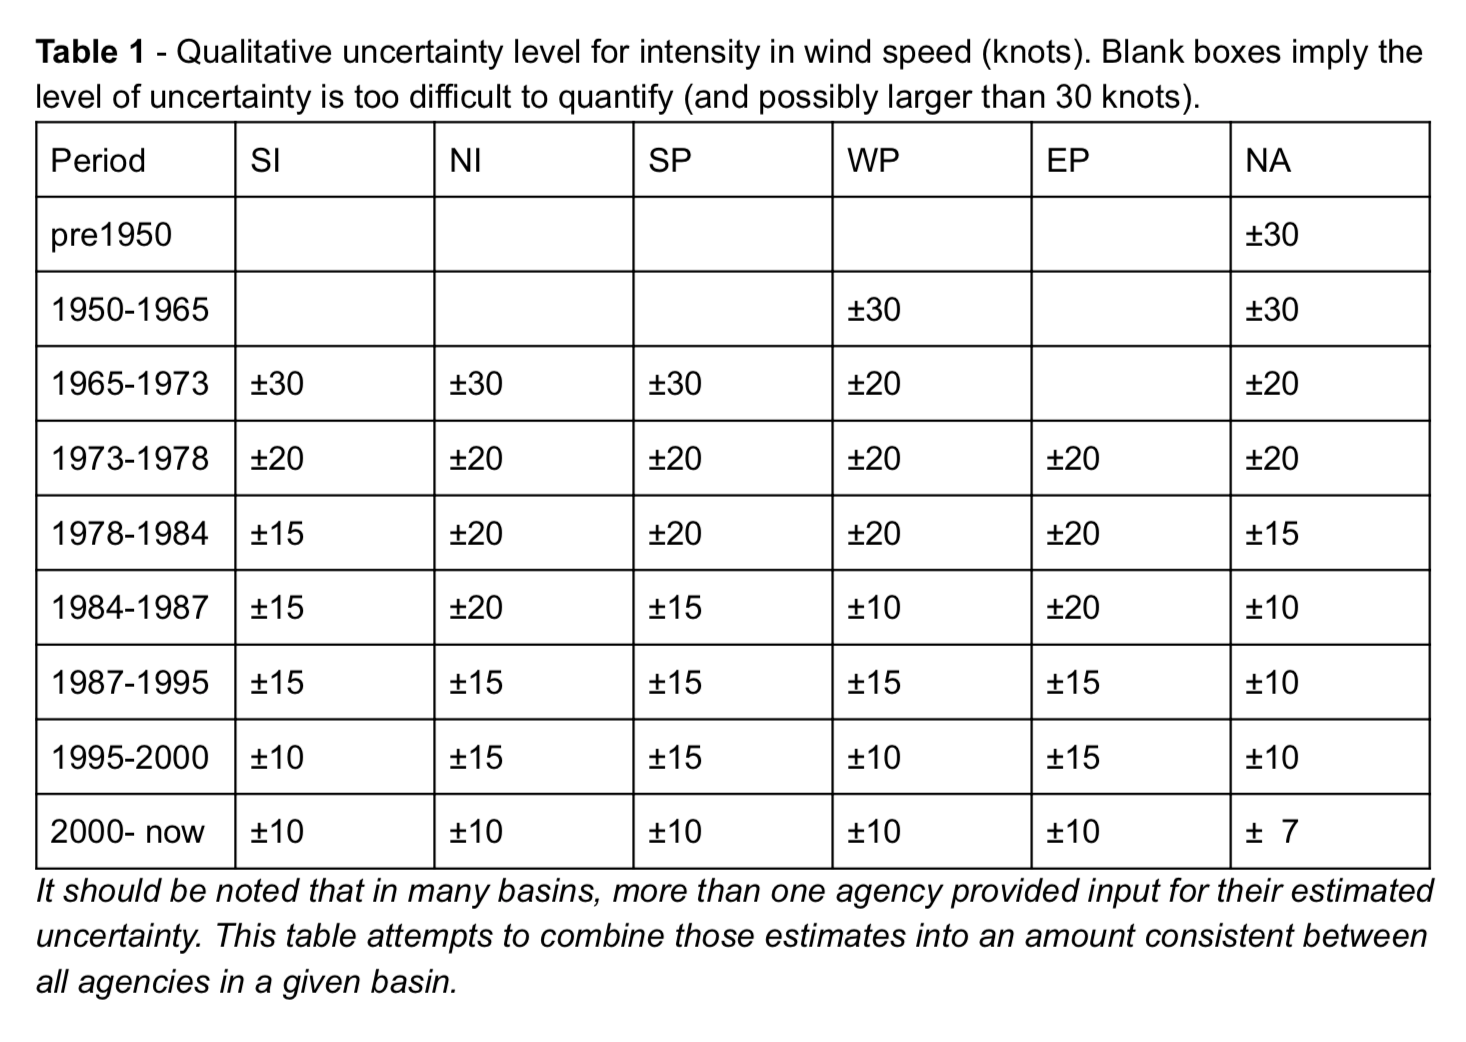
Estimating the position of the track is less accurate for weaker storms, as they have not as well defined eyes as larger storms. In places where aircraft reconnaissance is available (Western Pacific from 1950 - 1987 and the North Atlantic 1950 - present) the position uncertainties are markedly less than the values provided in table 2.
Further information: National Hurricane Center and Central Pacific Hurricane Center
Radiation & Clouds Observations
METEOSAT
| Field | Metadata |
|---|---|
| Name | Meteosat |
| Short Name | MSGCPP |
| Long Name | Meteosat Cloud Physical Properties |
| Version | 4.0 |
| Theme | Meteosat, shortwave radiation, cloud properties, satellite |
| Period of Time | 2014 - 07/2021 |
| Frequency | Discontinued |
| Update timelag | Discontinued |
| Time-resolution | Hourly |
| Spatial Type | Irregular grid, Geostationary Satellite at (0.0N/0.0S) |
| Spatial extent | 50°W to 50°E / 80°S to 80°N |
| Spatial resolution | 12 km at Nadir point (0 North, 0 East) |
| Coordinate system | WGS-84 |
| Earth model | WGS-84 |
| Publisher | KNMI (Dutch Meteorological Institute) |
| Date First Published | December 2011 |
| Detailed specification | HM Deneke, AJ Feijt, RA Roebeling. Estimating surface solar irradiance from METEOSAT SEVIRI-derived cloud properties, published, Remote Sens. Environ., 2008, 112 |
| Homepage URL | MSGCPP product description |
| Security Classification | Public |
| Access Level | No constraints |
| Licence | Access constraints |
Description: Indirectly derived/modelled shortwave radiation and cloud properties. The approach requires two independent steps: 1. Cloud properties are determined from narrow-band satellite radiances. 2. These cloud properties are used together with data on water vapour column and surface albedo to calculate the atmospheric flux transmittance. The retrieved irradiance is biased low by about 3-4 W/m throughout the year, corresponding to an underestimate in atmospheric flux transmittance of about 0.015 in summer and 0.04 in winter. From a least-squares linear regression, residual standard deviations of 56 W/m (0.072, 17.0%), 11 W/m (0.052, 10.8%), and 4 W/m (0.021, 4.2%) are found for hourly, daily and monthly mean irradiance (transmittance, relative error), respectively. These findings indicate that the accuracy of the retrieval is comparable to first-class pyranometers in the summer half year (5% of daily-mean values), but significantly lower in winter. Two aspects requiring further investigation have been identified: 1. For thin clouds, the atmospheric flux transmittance is strongly underestimated. 2. The retrieval accuracy is reduced or snow-covered surfaces.
Current dataset issues: The Meteosat data is available from one hour after sunrise until one hour before sunset, which means for the first and last hours with low sun angles, the radiation values are equal to zero. This leads to low values when data is aggregated to daily or monthly sums, with an underestimation of about 10 %. Therefore we recommend to replace all values below 50 W/m with radiation values from a weather model (e.g. NEMSGLOBAL)
Attention: The provider discontinued this dataset by the end of July 2021. For the meteoblue nowcast corrections of solar radiation and PV production, it is replaced by SARAH-2.
SARAH-2
| Field | Metadata |
|---|---|
| Name | SARAH-2 |
| Long Name | Surface Radiation Data Set - Heliosat (SARAH) - Edition 2 |
| Theme | Meteosat, shortwave radiation, satellite |
| Variables | Shortwave radiation, Clearsky shortwave radiation, DNI, Direct shortwave radiation, GTI |
| Period of Time | 09/2018 - present |
| Frequency | Daily |
| Update timelag | < 24 hours |
| Time-resolution | Hourly |
| Spatial Type | Irregular grid, Geostationary Satellite at (0.0N/0.0S) |
| Spatial extent | 50°W to 50°E / 80°S to 80°N |
| Spatial resolution | 0.05° |
| Coordinate system | WGS-84 |
| Earth model | WGS-84 |
| Publisher | Satellite Application Facility on Climate Monitoring (CM SAF) |
| Date First Published | 2017 |
| Detailed specification | Pfeifroth, Uwe; Kothe, Steffen; Müller, Richard; Trentmann, Jörg; Hollmann, Rainer; Fuchs, Petra; Werscheck, Martin (2017): Surface Radiation Data Set - Heliosat (SARAH) - Edition 2, Satellite Application Facility on Climate Monitoring, DOI:10.5676/EUM_SAF_CM/SARAH/V002. |
| Homepage URL | https://doi.org/10.5676/EUM_SAF_CM/SARAH/V002 |
Description: Surface Solar Radiation Data Set based on SARAH-2 methods is a satellite-based data set of the solar surface irradiance (global radiation), the surface direct irradiance (direct horizontal and direct normalized) and the sunshine duration derived from satellite-observations of the visible channels of the SEVIRI instruments onboard the geostationary Meteosat satellites, that is designed to continously extend the SARAH-2 climate data record in time.
SARAH-2 currently is the best available estimation of shortwave radiation!
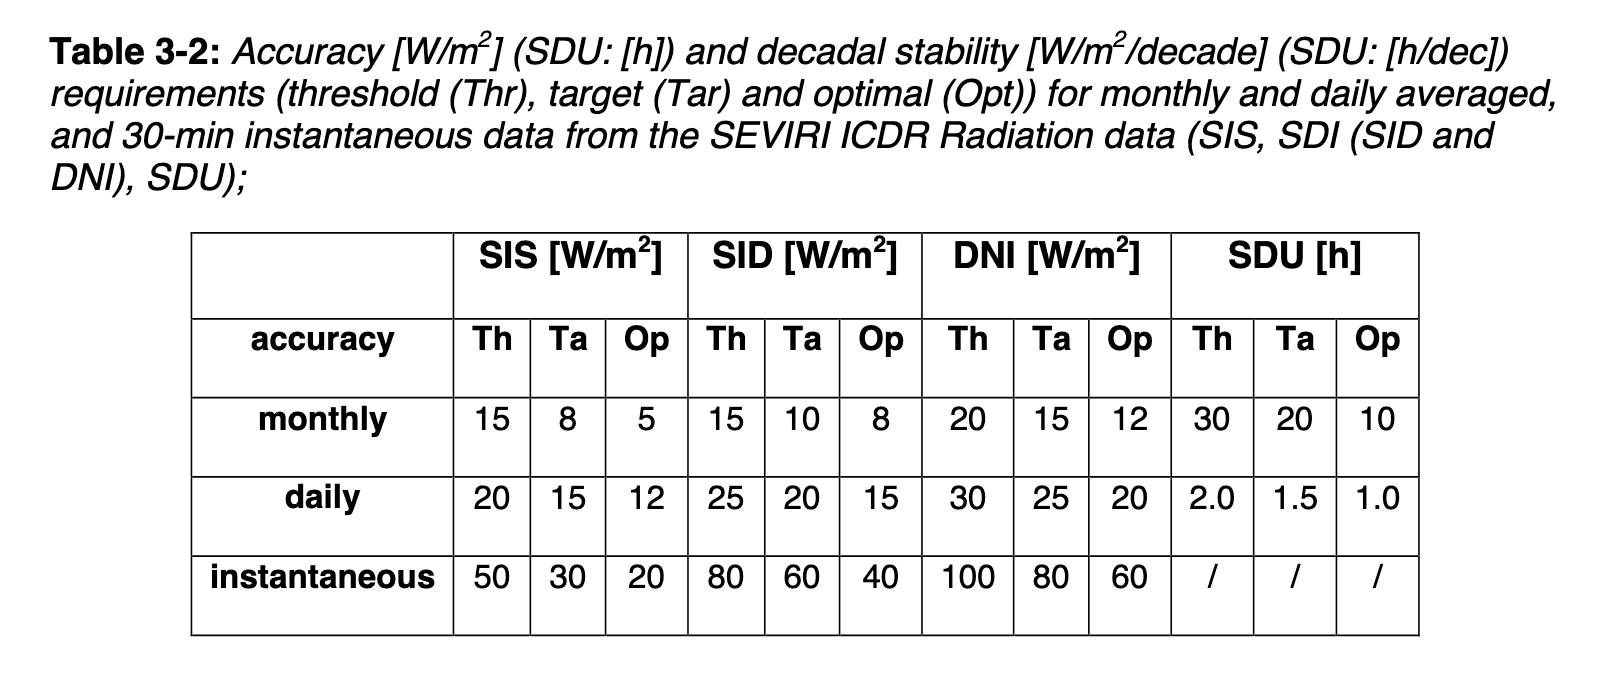
SIS: Shortwave radiation; SID: Direct shortwave radiation
Further information: SARAH-2, DWD
Himawari
| Field | Metadata |
|---|---|
| Name | Himawari |
| Theme | Meteosat, shortwave radiation, satellite |
| Variables | Shortwave radiation |
| Period of Time | 11/2023 - present |
| Frequency | 10 min |
| Time-resolution | Hourly |
| Spatial Type | Irregular grid, Geostationary Satellite at (0.0N/140.7E) |
| Spatial extent | Lat = (-60°; 60°) Lon = (80°; 200°) |
| Spatial resolution | 5 km |
| Publisher | Japan Meteorological Agency (JMA) Meteorological Satellite Center (MSC) |
| Homepage URL | https://www.data.jma.go.jp/mscweb/data/himawari/index.html |
IODC
| Field | Metadata |
|---|---|
| Name | IODC |
| Long Name | Indian Ocean Data Coverage |
| Theme | Meteosat, shortwave radiation, satellite |
| Variables | Shortwave radiation |
| Period of Time | 11/2023 - present |
| Frequency | 15 min |
| Time-resolution | Hourly |
| Spatial Type | Irregular grid, Geostationary Satellite at (0.0N/45.5E) |
| Spatial extent | Lat = (-60°,60°) Lon = (-15°, 75°) |
| Spatial resolution | 5 km |
| Publisher | EUMETSAT |
| Homepage URL | https://user.eumetsat.int/data/satellites/meteosat-second-generation/indian-ocean-data-coverage |
GOES
| Field | Metadata |
|---|---|
| Name | GOES-16 + GOES-18 |
| Long Name | Geostationary Operational Environmental Satellite GOES-16: GOES-East GOES-18: GOES-West |
| Theme | Meteosat, shortwave radiation, satellite |
| Variables | Shortwave radiation |
| Period of Time | 08/2023 - present |
| Frequency | 15 min |
| Time-resolution | Hourly |
| Spatial Type | Irregular grid, GOES-16: Geostationary Satellite at (0.0N/75.0W) GOES-18: Geostationary Satellite at (0.0N/137.2W) |
| Spatial extent | Lat = (-60°,60°) Lon = (225°,285°) + (-135°, -75°) |
| Spatial resolution | 5 km |
| Publisher | NOAA |
| Homepage URL | https://www.goes.noaa.gov/ |
Precipitation Observations
PDIR-Now
| Field | Metadata |
|---|---|
| Name | PDIR-Now |
| Long Name | PERSIANN Dynamic Infrared Rain Rate |
| Version | 1 |
| Theme | Satellite, precipitation, near-real-time |
| Variables | Precipitation |
| Period of Time | 03/2000 - present |
| Frequency | Daily |
| Update timelag | < 24 hours |
| Time-resolution | Daily |
| Spatial extent | 180°W to 180°E / 60°S to 60°N |
| Spatial resolution | 4 km |
| Coordinate system | WGS84 |
| Publisher | Center for Hydrometeorology and Remote Sensing (CHRS) of the University of California, Irvine |
| Detailed specification | Phu Nguyen, Mohammed Ombadi, Vesta Afzali Gorooh, Eric J. Shearer, Mojtaba Sadeghi, Soroosh Sorooshian, Kuolin Hsu, David Bolvin and Martin F. Ralph, 2020: PERSIANN Dynamic Infrared-Rain Rate (PDIR-Now): A Near-real time, Quasi-Global Satellite Precipitation Dataset. Journal of Hydrometeorology. Doi: https://doi.org/10.1175/JHM-D-20-0177.1 |
| Homepage URL | https://chrsdata.eng.uci.edu/ |
| Licence | Data is freely available. The data set source should be acknowledged when the data is used: Phu Nguyen, Mohammed Ombadi, Vesta Afzali Gorooh, Eric J. Shearer, Mojtaba Sadeghi, Soroosh Sorooshian, Kuolin Hsu, David Bolvin and Martin F. Ralph, 2020: PERSIANN Dynamic Infrared-Rain Rate (PDIR-Now): A Near-real time, Quasi-Global Satellite Precipitation Dataset. Journal of Hydrometeorology. Doi: https://doi.org/10.1175/JHM-D-20-0177.1 |
Description: Developed and maintained with support from UNESCO, ICIWaRM and others, the original Precipitation Estimation from Remotely Sensed Information Using Artificial Neural Networks– Cloud Classification System (PERSIANN-CCS) dataset provides quasi-global infrared-based precipitation estimates.
PDIR-Now is intended to supersede PERSIANN–CCS as the primary near-real-time, quasi-global satellite precipitation dataset of the PERSIANN family.
The main advantage of PDIR-Now, compared to other near-real time precipitation datasets, is its reliance on the high frequency sampled IR imagery; consequently, the latency of PDIR-Now from the time of rainfall occurrence is very short. Additionally, PDIR-Now accounts for the errors and uncertainties that result from the use of IR imagery by adopting a variety of techniques most notable is the dynamic shifting of (Tb-R) curves using rainfall climatology. The encouraging evaluation results in the present study indicate the potential of using the PDIR algorithm to reconstruct historical precipitation estimates at high spatiotemporal resolution.
IMERG
| Field | Metadata |
|---|---|
| Name | IMERG |
| Long Name | Integrated Multi-satellite retrievals for GPM |
| Datasets | IMERG-REALTIME (Officially known as IMERG late run) IMERG (Officially known as IMERG final run) |
| Version | 06B, 2020 |
| Theme | Satellite, precipitation, estimate |
| Variables | Precipitation |
| Period of Time | 06/2000 - present |
| Frequency | IMERG-REALTIME: daily IMERG: monthly |
| Update timelag | IMERG-REALTIME: 1 - 2 days IMERG: 4 months |
| Time-resolution | Daily |
| Spatial extent | Global |
| Spatial resolution | 0.1° / 10 km |
| Coordinate system | WGS-84 |
| Publisher | NASA GPM |
| Detailed specification | G. Huffman, D. Bolvin, D. Braithwaite, K. Hsu, R. Joyce, P. Xie, 2014: Integrated Multi-satellitE Retrievals for GPM (IMERG), version 4.4. NASA's Precipitation Processing Center |
| Homepage URL | Precipitation Data Directory |
| Licence | Data is freely available. The data set source should be acknowledged when the data is used: G. Huffman, D. Bolvin, D. Braithwaite, K. Hsu, R. Joyce, P. Xie, 2014: Integrated Multi-satellitE Retrievals for GPM (IMERG), version 4.4. NASA's Precipitation Processing Center |
Description: IMERG (Integrated Multi-satellite retrievals for GPM) intends to intercalibrate, merge, and interpolate “all” satellite microwave precipitation estimates, together with microwave-calibrated infrared (IR) satellite estimates, precipitation gauge analyses, and potentially other precipitation estimators at fine time and space scales for the TRMM and GPM eras over the entire globe.
Recommendation: Use the final run IMERG dataset for research. The vast majority of grid boxes have fairly similar real time and final values, so it makes sense to stick to metrics that are more resistant to occasional data disturbances. Extreme values are more sensitive to these details; medians, means, and root-mean square difference are less sensitive.
CMORPH
| Field | Metadata |
|---|---|
| Name | CMORPH |
| Long Name | NOAA CPC morphing technique |
| Version | 1.0, 2012 |
| Theme | Satellite, precipitation, estimate |
| Period of Time | 1998 - present |
| Frequency | Daily |
| Update timelag | 3 days |
| Time-resolution | Hourly |
| Spatial Type | Plate Carreé grid |
| Spatial extent | 180°W to 180°E / 60°S to 60°N |
| Spatial resolution | 8 km at the equator |
| Coordinate system | WGS-84 |
| Earth model | WGS-84 |
| Publisher | NCEP / NOAA |
| Date First Published | 2012 |
| Detailed specification | Joyce, R. J., J. E. Janowiak, P. A. Arkin, and P. Xie, 2004: CMORPH: A method that produces global precipitation estimates from passive microwave and infrared data at high spatial and temporal resolution.. J. Hydromet., 5, 487-503. |
| Homepage URL | NOAA NCEP CMORPH |
| Security Classification | Public |
| Access Level | https://www.usa.gov/government-works |
| Licence | Public |
Description: CMORPH (CPC MORPHing technique) produces global precipitation analysis at very high spatial and temporal resolution. This technique uses precipitation estimates that have been derived from low orbiter satellite microwave observations exclusively, and whose features are transported via spatial propagation information that is obtained entirely from geostationary satellite IR data. At present we incorporate precipitation estimates derived from the passive microwaves aboard the DMSP 13, 14 & 15 (SSM/I), the NOAA-15, 16, 17 & 18 (AMSU-B), and AMSR-E and TMI aboard NASA's Aqua and TRMM spacecraft, respectively. These estimates are generated by algorithms of Ferraro (1997) for SSM/I, Ferraro et al. (2000) for AMSU-B and Kummerow et al. (2001) for TMI. Note that this technique is not a precipitation estimation algorithm but a means by which estimates from existing microwave rainfall algorithms can be combined. Therefore, this method is extremely flexible such that any precipitation estimates from any microwave satellite source can be incorporated. With regard to spatial resolution, although the precipitation estimates are available on a grid with a spacing of 8 km (at the equator), the resolution of the individual satellite-derived estimates is coarser than that - more on the order of 12 x 15 km or so. The finer "resolution" is obtained via interpolation.
CHIRPS2
| Field | Metadata |
|---|---|
| Name | CHIRPS2 |
| Long Name | Climate Hazards Group Infrared Precipitation with Station data |
| Version | 2, 2015 |
| Theme | Satellite, precipitation, estimate |
| Period of Time | 1981 - present |
| Frequency | Daily |
| Update timelag | 6 - 7 days (final and corrected dataset up to 2 month) |
| Time-resolution | daily |
| Spatial Type | Plate Carreé grid |
| Spatial extent | 180°W to 180°E / 50°S to 50°N (origin: 179.975°W / 49.975°S) |
| Spatial resolution | 5 km (interpolated to 0.05°) |
| Coordinate system | WGS-84 |
| Earth model | WGS-84 |
| Publisher | CHG (Climate Hazards Group) |
| Date First Published | 2015 |
| Detailed specification | Chris Funk, Pete Peterson, Martin Landsfeld, Diego Pedreros, James Verdin, Shraddhanand Shukla, Gregory Husak, James Rowland, Laura Harrison, Andrew Hoell & Joel Michaelsen. "The climate hazards infrared precipitation with stations—a new environmental record for monitoring extremes". Scientific Data 2, 150066. doi:10.1038/sdata.2015.66 2015. https://www.nature.com/articles/sdata201566 |
| Security Classification | Public |
| Access Level | https://www.usa.gov/government-works |
| Licence | Public |
Description: Climate Hazards Group Infrared Precipitation with Station data (CHIRPS) is a 30+ year quasi-global rainfall dataset. Spanning 50°S - 50°N (and all longitudes), starting in 1981 to near-present, CHIRPS incorporates 0.05° resolution satellite imagery with in-situ station data to create gridded rainfall time series for trend analysis and seasonal drought monitoring.
ARC2
| Field | Metadata |
|---|---|
| Name | ARC-2 |
| Long Name | African Rainfall Climatology version 2 |
| Version | 2, 2012 |
| Theme | Satellite, precipitation, estimate |
| Period of Time | 1983 - present |
| Frequency | Daily |
| Update timelag | < 24 hours |
| Time-resolution | Daily |
| Spatial Type | Plate Carreé grid |
| Spatial extent | Africa, 20°W to 55°E / 40°S to 40°N (origin: 20.0°W / 40.0°S) |
| Spatial resolution | 10 km (interpolated to 0.1°) |
| Coordinate system | WGS-84 |
| Earth model | WGS-84 |
| Publisher | NOAA Climate Prediction Center |
| Date First Published | 2012 |
| Detailed specification | Link |
| Homepage URL | Link |
| Security Classification | Public |
| Access Level | https://www.usa.gov/government-works |
| Licence | Public |
Description: The African Rainfall Climatology, version 2 (ARC2), it is a revision of the first version of the ARC. Consistent with the operational Rainfall Estimation, version 2, algorithm (RFE2), ARC2 uses inputs from two sources: 1) 3-hourly geostationary infrared (IR) data centered over Africa from the European Organisation for the Exploitation of Meteorological Satellites (EUMETSAT) and 2) quality-controlled Global Telecommunication System (GTS) gauge observations reporting 24h rainfall accumulations over Africa.
The main difference with ARC1 resides in the recalibration of all Meteosat First Generation (MFG) IR data (1983–2005). Results show that ARC2 is a major improvement over ARC1.
It is consistent with other long-term datasets, such as the Global Precipitation Climatology Project (GPCP) and Climate Prediction Center (CPC) Merged Analysis of Precipitation (CMAP), with correlation coefficients of 0.86 over a 27-yr period. However, a marginal summer dry bias that occurs over West and East Africa is examined. Daily validation with independent gauge data shows RMSEs of 11.3, 13.4, and 14, respectively, for ARC2, Tropical Rainfall Measuring Mission Multi-satellite Precipitation Analysis 3B42, version 6 (3B42v6), and the CPC morphing technique (CMORPH) for the West African summer season. The ARC2 RMSE is slightly higher for Ethiopia than those of CMORPH and 3B42v6. Both daily and monthly validations suggested that ARC2 underestimations may be attributed to the unavailability of daily GTS gauge reports in real time, and deficiencies in the satellite estimate associated with precipitation processes over coastal and orographic areas.
However, ARC2 is expected to provide users with real-time monitoring of the daily evolution of precipitation, which is instrumental in improved decision making in famine early warning systems.
LATAMCOSCH
| Field | Metadata |
|---|---|
| Name | LATAMCOSCH |
| Long Name | Latin American Combined Scheme Gauge-Satellite based precipitation |
| Version | 1 |
| Theme | Satellite, precipitation, estimate |
| Period of Time | 03/2000 - 08/2022 |
| Frequency | Daily |
| Update timelag | 1 day |
| Time-resolution | Daily |
| Spatial Type | Plate Carreé grid |
| Spatial extent | South & Central America, 120°W to 30°W / 33°N to 60°S |
| Spatial resolution | 0.25° |
| Coordinate system | WGS-84 |
| Earth model | WGS-84 |
| Publisher | Centro de Previsão de Tempo e Estudos Climáticos - INPE - Brasília |
| Date First Published | 2000 |
| Homepage URL | Link |
| Security Classification | Public |
| Access Level | The products may not be used for commercial purposes unless the user has written authorization from CPTEC/INPE. |
| Licence | Public |
Description: The combined scheme approach provides a new high-resolution, gauge–satellite-based analysis of daily precipitation over continental South America. This methodology is based on a combination of additive and multiplicative bias correction schemes to get the lowest bias when compared with the observed values (rain gauges). In this case, real-time TRMM Multisatellite Precipitation Analysis (in which no rain gauges are incorporated), is used as a rainfall algorithm, whereas a daily rain gauge database is used to correct the bias on a daily basis over South America. In a second step, and considering that TRMM mission ended in 2015 and Global Precipitation Measurement started in the same year, the replacement of the TMPA algorithm for Integrated Multi-Satellite Retrievals will be considered once that algorithm can be reprocessed for a suitable number of years to perform a reliable validation.
CPCGBA-US
| Field | Metadata |
|---|---|
| Name | CPCGBAUS |
| Long Name | NOAA Climate Prediction Center: gauge based analysis - US |
| Version | 2 |
| Theme | Precipitation, estimate |
| Period of Time | 1948 - present |
| Frequency | Daily |
| Update timelag | > 24 hours |
| Time-resolution | Daily |
| Spatial Type | Plate Carreé grid |
| Spatial extent | USA, 129.875°E to 55.125°E / 20.125°N to 49.875°N |
| Spatial resolution | 25 km |
| Coordinate system | WGS-84 |
| Earth model | WGS-84 |
| Publisher | NOAA Climate Prediction Center |
| Date First Published | 1948 |
| Detailed specification | Link |
| Homepage URL | Link |
| Security Classification | Public |
| Access Level | https://opendatacommons.org/licenses/odbl/ |
| Licence | Public |
Description: The goal of this dataset is to create a suite of unified precipitation products with consistent quantity and improved quality by combining all information sources available at CPC and by taking advantage of the optimal interpolation objective analysis technique. The gauge analysis here covers the Conteminous United States on a fine-resolution and is quantitatively consistent with that covering the global land on a coarser resolution.
Air Quality Simulations
CAMSGLOBAL
| Field | Metadata |
|---|---|
| Name | CAMSGLOBAL |
| Short Name | CAMS |
| Long Name | Copernicus atmospheric monitoring service |
| Theme | Air quality, aerosol, desert dust, ozone, PM10, PM2.5, SO2, air pollution |
| Period of Time | 2017 - present |
| Frequency | Daily |
| Update timelag | < 24 hours |
| Time-resolution | Hourly |
| Spatial Type | ECMWF N320 reduced Gaussian Grid (derived from spherical harmonics with a triangular truncation of T639) |
| Spatial extent | Global, 180°W to 180°E / 89.784°S to 89.784°N |
| Spatial resolution | 40 km |
| Coordinate system | WGS-84 |
| Earth model | WGS-84 |
| Publisher | ECMWF |
| Date First Published | 2017 |
| Detailed specification | Link |
| Homepage URL | Link |
| Security Classification | Public |
| Access Level | Link |
| Licence | Public |
CAMSEU
| Field | Metadata |
|---|---|
| Name | CAMSEU |
| Long Name | Copernicus atmospheric monitoring service for Europe |
| Theme | Air quality, ozone, carbon monoxide, PM10, PM2.5, SO2, pollen, air pollution |
| Period of Time | 04/2018 - present |
| Frequency | Daily |
| Update timelag | < 24 hours |
| Time-resolution | Hourly |
| Spatial Type | ECMWF N320 reduced Gaussian Grid (derived from spherical harmonics with a triangular truncation of T639) |
| Spatial extent | Europe, 20°W to 45°E / 30°N to 70°N |
| Spatial resolution | 0.1° |
| Coordinate system | WGS-84 |
| Earth model | WGS-84 |
| Publisher | ECMWF |
| Date First Published | 2018 |
| Detailed specification | https://www.regional.atmosphere.copernicus.eu/ |
| Homepage URL | https://www.regional.atmosphere.copernicus.eu/ |
| Security Classification | Public |
| Access Level | Link |
| Licence | Public |
Description: The ensemble model (so called CAMS regional Ensemble) is based on seven state-of-the-art numerical air quality models developed in Europe. They are combined via an ensemble approach, consisting in calculating the median value of the individual outputs. Usually, better estimates of air pollutant concentrations are generated by CAMS regional Ensemble.
Ocean Simulations
ERA5 Ocean
The ERA5 Ocean dataset provides hourly data for different sea variables, with a resolution of 40 km.
These variables are availabe with the ERA5 Ocean dataset:
- Significant Height of Swell Waves
- Significant Height of Wind Waves
- Significant Wave Height (Wind and Swell)
- Mean Direction of Swell Waves
- Mean Period of Swell Waves
- Mean Wave Direction
- Mean Wave Period
- Mean Wind Wave Direction
- Mean Wind Wave Period
Detailed information about the ERA5 ocean dataset can be found here.
WW3ENS
| Field | Metadata |
|---|---|
| Name | WW3ENS |
| Long Name | Wavewatch III Ensemble |
| Version | 5.16 |
| Theme | Sea, ocean, wave, swell, wind wave direction, height of swell waves |
| Period of Time | 10/2020 - present |
| Frequency | Daily |
| Update timelag | < 24 hours |
| Time-resolution | Hourly |
| Spatial Type | Plate Carreé grid |
| Spatial extent | Global |
| Spatial resolution | 10 km |
| Coordinate system | WGS-84 |
| Earth model | WGS-84 |
| Publisher | NOAA / NCEP |
| Date First Published | 2020 |
| Detailed specification | https://polar.ncep.noaa.gov/waves/wavewatch/ |
| Homepage URL | https://polar.ncep.noaa.gov/waves/wavewatch/ |
| Security Classification | Public |
| Access Level | https://www.usa.gov/government-works |
| Licence | Public |
Description: For longer time series than available from WW3ENS, it is recommended to use ERA5 Ocean instead.
RTOFS
| Field | Metadata |
|---|---|
| Name | RTOFS |
| Long Name | Real time ocean forecast system |
| Version | 2 |
| Theme | Sea, ocean, salinity, currents, temperature |
| Period of Time | 2021 - present |
| Frequency | Daily |
| Update timelag | < 24 hours |
| Time-resolution | Hourly |
| Spatial Type | Mercator grid and arctic, bipolar patch |
| Spatial extent | Global |
| Spatial resolution | 9 km |
| Coordinate system | WGS-84 |
| Earth model | WGS-84 |
| Publisher | NOAA / NCEP |
| Date First Published | 2020 |
| Detailed specification | Bleck, R., 2002: An oceanic general circulation model framed in hybrid isopycnic-cartesian coordinates. Ocean Modeling, 4, 55-88. |
| Homepage URL | https://polar.ncep.noaa.gov/global/ |
| Security Classification | Public |
| Access Level | https://www.usa.gov/government-works |
| Licence | Public |
Content: Ocean salinity, temperature, U-current, V-current.
EWAM, GWAM
EWAM and GWAM are the ocean wave forecast models from the German weather service DWD, based on their atmospheric model ICON. EWAM covers the sea around Europe (30°N to 66°N, 10.50°W to 42.00°E), with a resolution of 5km. GWAM is the global model (180°W to 180°E, 85.25°S to 89.25°N), with a resolution of 28km. The data is available since January 2019 till 3 days (EWAM) resp. 7 days ahead (GWAM).
Content: Same variables as ERA5 Ocean, as well as peak wave period of wind and swell waves
Source and further information: Ocean wave forecasts based on DWD-Model ICON, DWD.
MFWAM
The Météo-France Wave Model (MFWAM-8) is a global wave forecasting model with a spatial resolution of 8 km and a time resolution of 3-hourly intervals. It is updated daily and its data can be visualised on the meteoblue Weather Maps or accessed via the Dataset API for the time period from May 2024 to the present. This model is utilised in the Forecast API "Sea" package and is sourced from Copernicus and Météo-France. For further information, please visit Copernicus.
MEDWAM
The Mediterranean Sea Waves Analysis and Forecast system (MEDWAM) provides wave data for the Mediterranean Sea with a spatial resolution of 4 km and an hourly time resolution. It operates on the WGS-84 coordinate system and is updated daily. The data, available from May 2024 onward via the Dataset API, can be visualised on meteoblue Weather Maps. This model is sourced from Copernicus. For further information, please visit Copernicus.
IBIWAM
The IBIWAM model covers the Atlantic region, specifically the Iberian, Biscay, and Irish areas, with a spatial resolution of 5 km and an hourly time resolution. Updated daily, the model’s data can be visualised on meteoblue Weather Maps or accessed via the Dataset API starting from May 2024. This model is provided by Copernicus. For further information, please visit Copernicus.
BALWAM
The BALWAM model focuses on the Baltic Sea region, offering a spatial resolution of 2 km and hourly temporal resolution. This model’s data is available in the Dataset API from May 2024 onwards, and can be visualised on the meteoblue Weather Maps. The model is sourced from Copernicus and the Finnish Meteorological Institute (FMI). For further information, please visit Copernicus.
Vegetation Health Observations
VHP
| Field | Metadata |
|---|---|
| Name | VHP |
| Long Name | Vegetation health products |
| Short Title | VHP |
| Theme | NDVI, vegetation, vegetation health |
| Period of Time | 1984 - present |
| Frequency | Weekly |
| Update timelag | < 2 months |
| Time-resolution | Weekly values (52 values per year) |
| Spatial Type | Plate Carreé grid |
| Spatial extent | 180°E to 180°W / 55°S to 75°N |
| Spatial resolution | 4 km, 0.05° |
| Coordinate system | WGS-84 |
| Earth model | WGS-84 |
| Publisher | NOAA Climate Prediction Center |
| Date First Published | 2012 |
| Detailed specification | https://www.star.nesdis.noaa.gov/smcd/emb/vci/VH/vh_datasets.php |
| Homepage URL | https://www.star.nesdis.noaa.gov/smcd/emb/vci/VH/vh_datasets.php |
| Security Classification | Public |
| Access Level | https://www.usa.gov/government-works |
| Licence | Public |
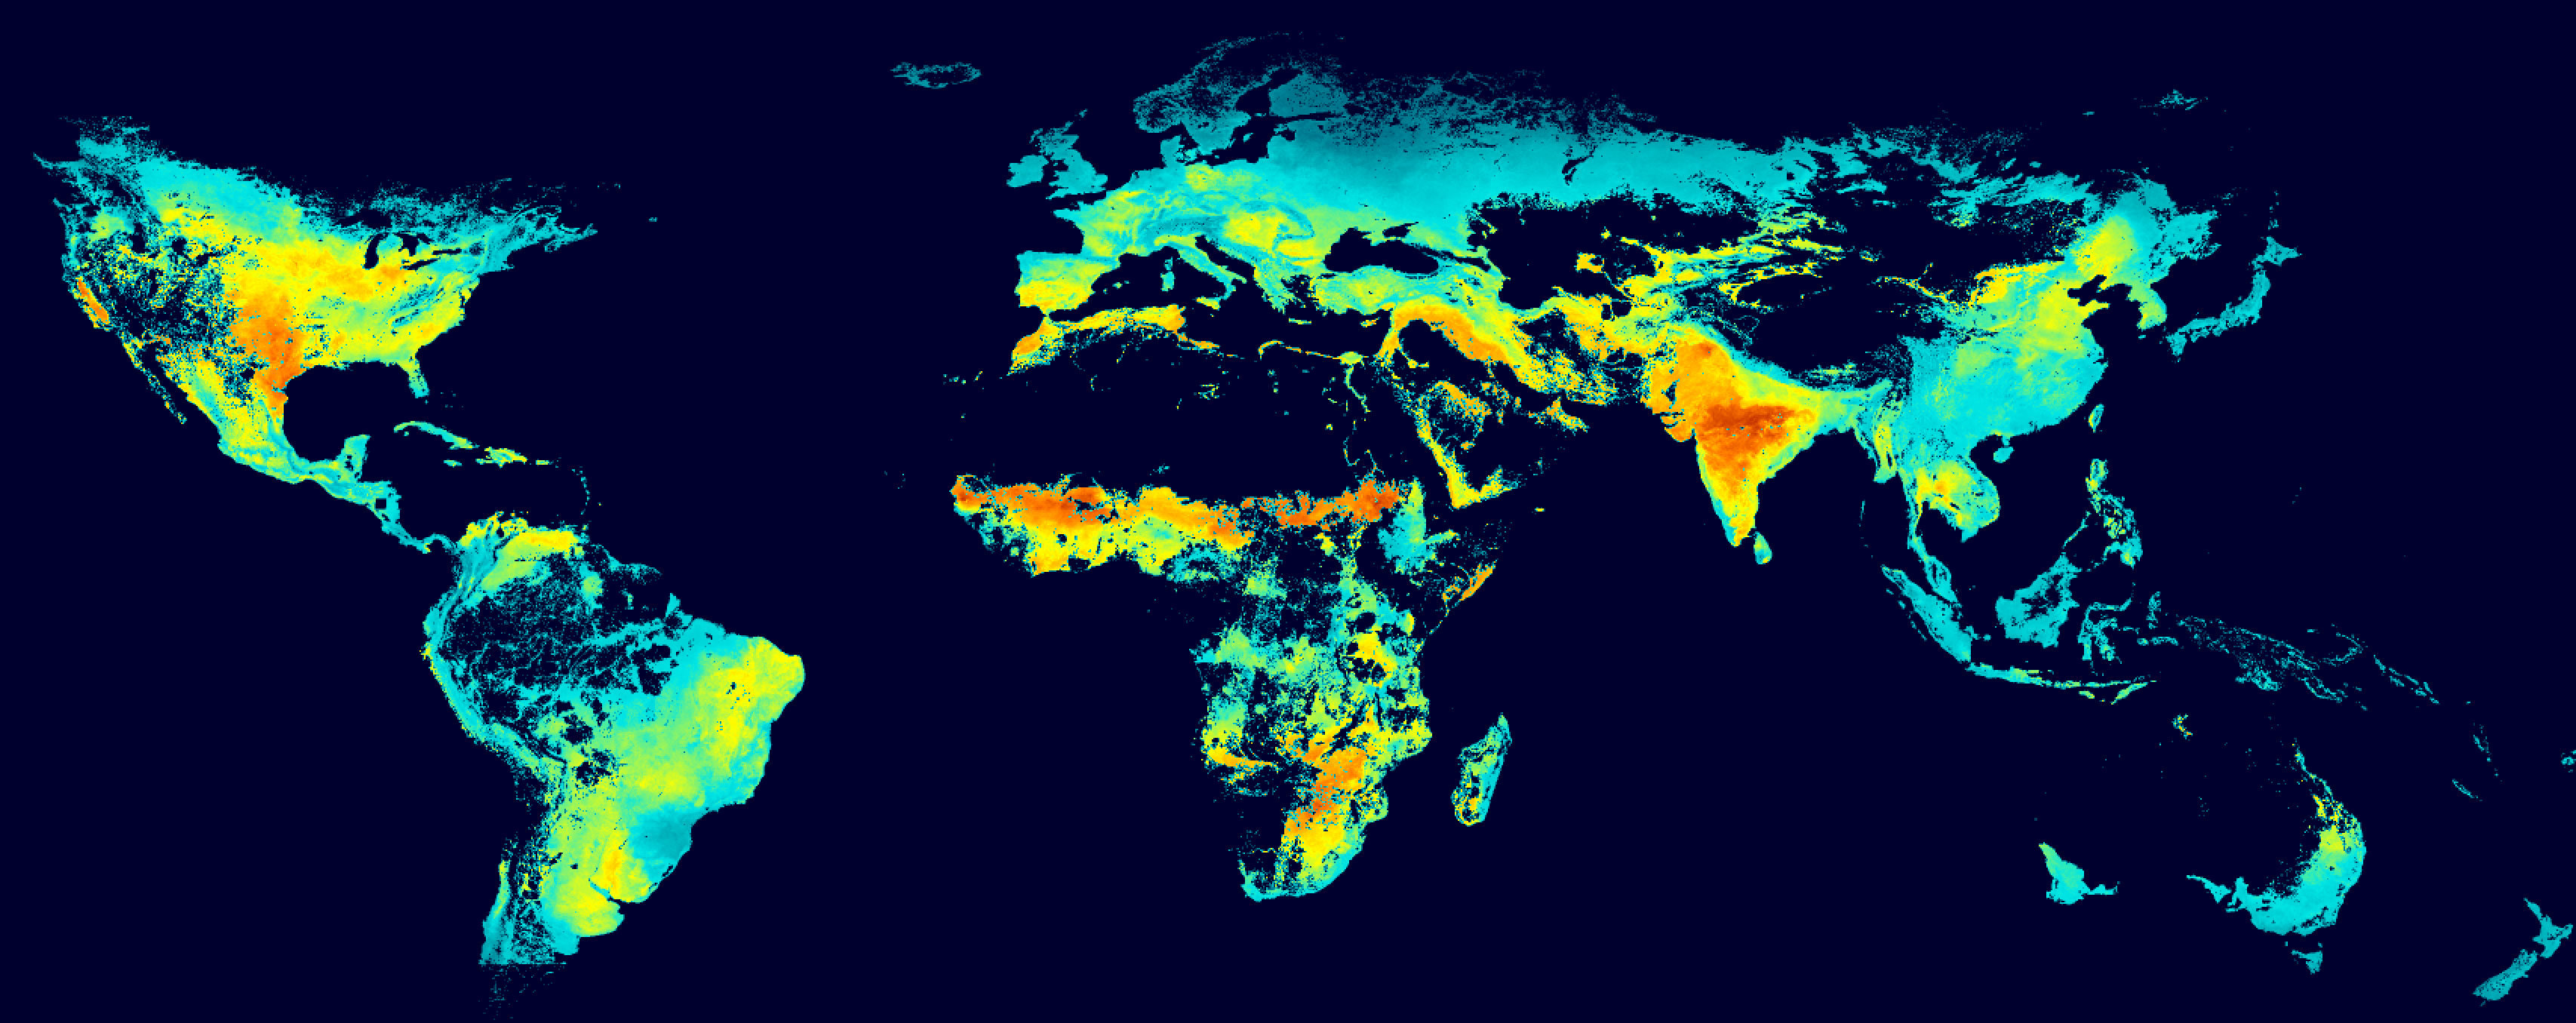
Description: The Vegetation Health Products (VH) of NOAA consist of gridded weekly global vegetation indices: temperature condition index, vegetation condition index, vegetation health index, NDVI and brightness temperature (BT). The data is derived from AVHRR GAC orbital satellites for the global area between latitude 55°S to 75°N. The spatial resolution is 0.036° (about 4km at equator). Noise is minimized by applying the time series smoothing technique and other correction algorithms. The dataset is updated weekly. There is an archive of this dataset for almost every week since 1984.
The VH are indices, which range from 0 to 100 characterizing changes in vegetation conditions from extremely poor (0) to excellent (100). The VH values below 40 are used for identifying vegetation stress, which is an indirect drought indicator. The VH is very useful for early drought detection, assessing drought area coverage, duration, and intensity, and for monitoring drought impacts on vegetation and agricultural crops. The NDVI and BT were filtered in order to eliminate high frequency noise. They were also adjusted for a non-uniformity of the land surface due to climate and ecosystem differences using multi-year NDVI and BT data.
Current dataset issues: VHP: due to a change of satellite, NDVI values from March 2018 until present are significantly higher than historic values. NOAA is working on the problem and make calibrated values available later in 2018.
Soil Characteristics
SoilGrids
| Field | Metadata |
|---|---|
| Name | SoilGrids |
| Long Name | SoilGrids 250m / SoilGrids 1000m |
| Version | 0.5.8 |
| Theme | Soil characteristics, soil type, water capacity, clay, sand, silt, ph |
| Period of Time | Static |
| Frequency | One-time |
| Spatial Type | Plate Carreé grid |
| Spatial extent | 180°W to 180°E / 56°S to 90°N (origin: 180.0°W / 56.0°S) |
| Spatial resolution | 250 m (interpolated to 0.0020833330°) 1000 m (interpolated to 0.008333332°) |
| Coordinate system | WGS-84 |
| Earth model | WGS-84 |
| Publisher | ISRIC – World Soil Information |
| Date First Published | 2017 |
| Detailed specification | Hengl, T., Mendes de Jesus, J., Heuvelink, G. B. M., Ruiperez Gonzalez, M., Kilibarda, M. et al. (2017) SoilGrids250m: global gridded soil information based on Machine Learning. PLoS ONE 12(2): e0169748. doi:10.1371/journal.pone.0169748. Hengl T, de Jesus JM, MacMillan RA, Batjes NH, Heuvelink GBM, et al. (2014) SoilGrids1km — Global Soil Information Based on Automated Mapping. PLoS ONE 9(8): e105992. doi:10.1371/journal.pone.0105992 Shangguan, W., Hengl, T., de Jesus, J. M., Yuan, H. and Dai, Y. (2016), Mapping the global depth to bedrock for land surface modeling. J. Adv. Model. Earth Syst. doi:10.1002/2016MS000686 |
| Homepage URL | https://www.isric.org/explore/soilgrids |
| Security Classification | Public |
| Access Level | https://opendatacommons.org/licenses/odbl/ https://www.isric.org/about/data-policy |
| Licence | Public |
Description: SoilGrids is a system for automated soil mapping based on state-of-the-art spatial predictions methods. SoilGrids estimates are based on globally fitted models using soil profile and environmental covariate data. The 250 m spatial resolutions datasets were produced using automated soil mapping based on machine learning algorithms.
How to Interprete USDA Texture Classes Values
The values returned from SoilGrids -> USDA texture classes are corresponding to the quantity in the following lookup table:
<ColorMap>
    <ColorMapEntry color="#d5c36b" label="Cl" opacity="1.0" quantity="1" />
    <ColorMapEntry color="#b96947" label="SiCl" opacity="1.0" quantity="2" />
    <ColorMapEntry color="#9d3706" label="SaCl" opacity="1.0" quantity="3" />
    <ColorMapEntry color="#ae868f" label="ClLo" opacity="1.0" quantity="4" />
    <ColorMapEntry color="#f86714" label="SiClLo" opacity="1.0" quantity="5" />
    <ColorMapEntry color="#46d143" label="SaClLo" opacity="1.0" quantity="6" />
    <ColorMapEntry color="#368f20" label="Lo" opacity="1.0" quantity="7" />
    <ColorMapEntry color="#3e5a14" label="SiLo" opacity="1.0" quantity="8" />
    <ColorMapEntry color="#ffd557" label="SaLo" opacity="1.0" quantity="9" />
    <ColorMapEntry color="#fff72e" label="Si" opacity="1.0" quantity="10" />
    <ColorMapEntry color="#ff5a9d" label="LoSa" opacity="1.0" quantity="11" />
    <ColorMapEntry color="#ff005b" label="Sa" opacity="1.0" quantity="12" />
    <ColorMapEntry color="#ffffff" label="NODATA" opacity="0.0" quantity="255" />
</ColorMap>
where Cl = clay, Si=Silt, Sa=Sand, Lo=Loam.
How to Interpret the USDA 2014 Taxonomy Suborder Classes
The values returned correspond to the following table: Link
How to Interpret the WRB 2006 Taxonomy Suborder Classes
The values returned correspond to the following table: Link
SoilGrids for Croplands
The soilgrids2_cropland10 dataset is SoilGrids2 data aggregated to 10km resolution considering only the regions with cropland. The values are aggregated according to the respective cropland fraction. Thus an original 250m pixel with 100% cropland fraction has 10 times more influence in computing the 10km mean value than a 250m pixel with only 10% cropland fraction. In areas with no cropland growing, all values are Nan.
This is the preferred dataset to use for agricultural purposes, as soilgrid values outside of cropland should not be considered.
WISE
| Field | Metadata |
|---|---|
| Name | WISE |
| Long Name | WISE30 |
| Version | 0.5.8 |
| Theme | Soil properties, field capacity, water content, gypsum content, nitrogen content, carbonate content |
| Period of Time | Static |
| Frequency | One-time |
| Spatial Type | Plate Carreé grid |
| Spatial extent | 180°W to 180°E / 56°S to 90°N (origin: 180.0°W / 56.0°S) |
| Spatial resolution | 1 km (interpolated to 0.008333333°) |
| Coordinate system | WGS-84 |
| Earth model | WGS-84 |
| Publisher | ISRIC – World Soil Information |
| Date First Published | 2016 |
| Detailed specification | Batjes NH 2016. Harmonised soil property values for broad-scale modelling (WISE30sec) with estimates of global soil carbon stocks. Geoderma 2016(269), 61-68 ( http://dx.doi.org/10.1016/j.geoderma.2016.01.034), with supplemental information (ISRIC Report 2015/01). |
| Homepage URL | https://www.isric.org/explore/wise-databases |
| Security Classification | Public |
| Access Level | https://opendatacommons.org/licenses/odbl/ https://www.isric.org/about/data-policy |
| Licence | Public |
Description: A coarser resolution soil dataset generated by ISRIC. The dataset was created using the soil map unit delineations of the broad scale Harmonised World Soil Database, version 1.21, with minor corrections, overlaid by a climate zones map (Köppen-Geiger) as co-variate, and soil property estimates derived from analysis of the ISRIC-WISE soil profile database for the respective mapped ‘soil/climate’ combinations. It can be used to address a range of global issues, assessments of crop production, soil vulnerability to pollution, soil carbon stocks and change, and soil gaseous emission potentials. meteoblue only includes a few variables, as most are already available in the higher resolution 250m ISRIC version.
The soil drainage classification (FAO 2006) data follows these classes:
| Class | Description |
|---|---|
| 1 | Very poorly drained |
| 2 | Poorly drained |
| 3 | Imperfectly drained |
| 4 | Moderately well drained |
| 5 | Well-drained |
| 6 | Somewhat excessively drained |
| 7 | Excessively drained soils |
SMAP
| Field | Metadata |
|---|---|
| Name | SMAP |
| Long Name | Enhanced SMAP Global Soil Moisture Data |
| Version | L3, V2 |
| Theme | Soil moisture |
| Period of Time | 04/2015 - present |
| Frequency | Daily |
| Update timelag | 1 week |
| Time-Resolution | 3 days |
| Spatial extent | 180°W to 180°E / 60°S to 90°N |
| Spatial resolution | 9 km |
| Coordinate system | WGS84 |
| Publisher | NASA USDA |
| Detailed specification | O'Neill, P. E., S. Chan, E. G. Njoku, T. Jackson, and R. Bindlish. 2018. SMAP Enhanced L3 Radiometer Global Daily 9 km EASE-Grid Soil Moisture, Version 2. [Indicate subset used]. Boulder, Colorado USA. NASA National Snow and Ice Data Center Distributed Active Archive Center. doi: https://doi.org/10.5067/RFKIZ5QY5ABN. |
| Homepage URL | https://nsidc.org/data/SPL3SMP_E/versions/2 |
| Licence | Public, citation required: O'Neill, P. E., S. Chan, E. G. Njoku, T. Jackson, and R. Bindlish. 2018. SMAP Enhanced L3 Radiometer Global Daily 9 km EASE-Grid Soil Moisture, Version 2. [Indicate subset used]. Boulder, Colorado USA. NASA National Snow and Ice Data Center Distributed Active Archive Center. doi: https://doi.org/10.5067/RFKIZ5QY5ABN. |
Description: The NASA-USDA Enhanced SMAP Global soil moisture data provides soil moisture information across the globe at 9 km spatial resolution. The data set is generated by integrating satellite-derived Soil Moisture Active Passive (SMAP) soil moisture observations into the modified two-layer Palmer model using a 1- D Ensemble Kalman Filter (EnKF) data assimilation approach. The Palmer model is driven by precipitation and temperature observations provided by the United States (U.S.) Air Force 557th Weather Wing (formerly known as the U.S. Air Force Weather Agency, AFWA). The current SMAP data archive spans from April 2015 to present and provides multiple soil moisture products developed using different algorithms. Here, we used the Level 3 (L3) SMAP product generated using the single channel algorithm (SCA).
The assimilation of the SMAP soil moisture observations helps improve the model-based soil moisture predictions particularly over poorly instrumented areas of the world that lack good quality precipitation data.
Detailed explanation of available soil moisture variables:
Profile Column Integral
Surface Soil Moisture
Subsurface Soil Moisture
Landuse Classifications
GFSAD
| Field | Metadata |
|---|---|
| Name | GFSAD |
| Short Name | GFSAD30 / GFSAD250 / GFSAD1000 / GFSAD4000 |
| Long Name | Global Food Security-Support Analysis Data at 30 m / 250 m / 1 km / 4 km |
| Version | 1.0 |
| Theme | Cropland fraction, land-sea mask, land fraction |
| Period of Time | Static |
| Frequency | One-time |
| Spatial Type | Plate Carreé grid |
| Spatial extent | 180°W to 180°E / 60°S to 90°N (origin: 180.0°W / 60.0955°S) |
| Spatial resolution | 30 m (interpolated to 0.00026949459°) 250 m (interpolated to 0.0021559568°, meteoblue aggregation) 1 km (interpolated to 0.0086238272°, meteoblue aggregation) 4 km (interpolated to 0.0344953088°, meteoblue aggregation) |
| Coordinate system | WGS-84 |
| Earth model | WGS-84 |
| Publisher | NASA / USGS |
| Date First Published | 2017 |
| Detailed specification | https://geography.wr.usgs.gov/science/croplands/index.html |
| Homepage URL | Link |
| Security Classification | Public |
| Access Level | https://www.usa.gov/government-works |
| Licence | Public |
Description: The GFSAD30 is a NASA funded project to provide high resolution global cropland data and their water use that contributes towards global food security in the twenty-first century. The GFSAD30 products are derived through multi-sensor remote sensing data (e.g., Landsat, MODIS, AVHRR). meteoblue provides the original cropland mask at 30 m resolution, as well as aggregated versions at coarser resolutions of 250 m and 1 km. The aggregated versions give the spatial fraction of cropland within a 250x250 m or 1x1 km box, respectively.
Furthermore a global land-water mask is available at 30 m, 250 m and 1 km resolution, indicating the fraction of the grid box, which is covered with land.
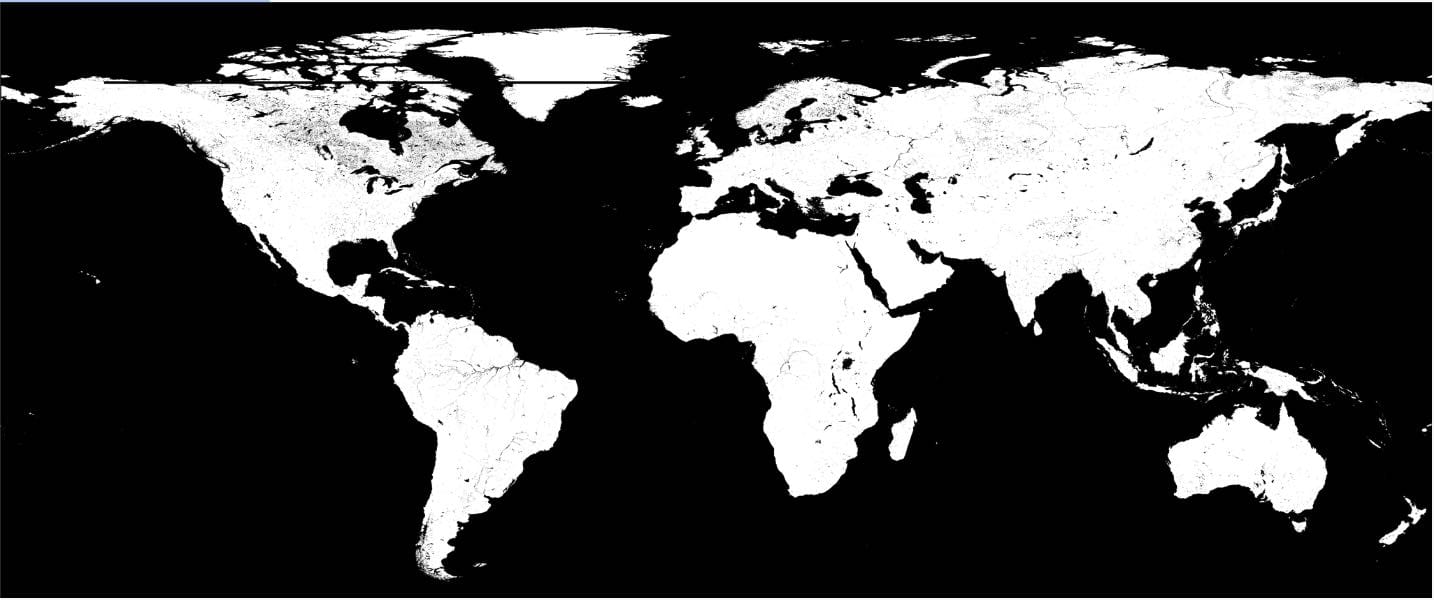
Image above: Landmask for GFSAD. The land mask in polar regions in the very north of Canada and on the Greenland icesheet have a stripe of missing data due to missing satellite imagery.
GLOBCOVER
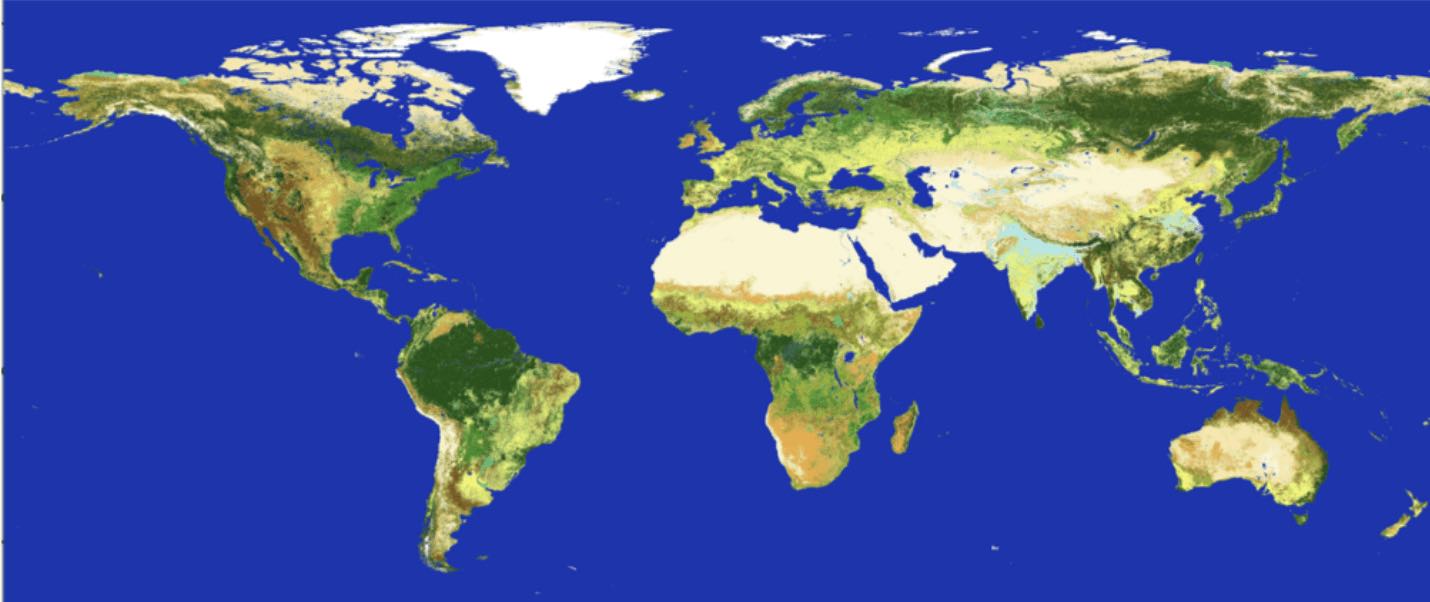
| Field | Metadata |
|---|---|
| Name | GlobCover |
| Version | 2.3 |
| Theme | Land cover classification |
| Period of Time | Static |
| Spatial extent | 180°W to 180°E / 65°S to 90°N |
| Spatial resolution | 300 m |
| Coordinate system | WGS-84 |
| Earth model | WGS-84 |
| Spatial reference system | Plate Carreé grid |
| Publisher | European Space Agency ESA |
| Date First Published | 2005 |
| Link to detailed specification | Link |
| Homepage URL | http://due.esrin.esa.int/page_globcover.php |
| Security Classification | Public |
| Access Level | https://www.usa.gov/government-works |
Description: GlobCover is an ESA initiative which began in 2005 in partnership with JRC, EEA, FAO, UNEP, GOFC-GOLD and IGBP. The aim of the project was to develop a service capable of delivering global composites and land cover maps using as input observations from the 300 m MERIS sensor on board the ENVISAT satellite mission.
Licence: The GlobCover products have been processed by ESA and by the Université Catholique de Louvain. They are made available to the public by ESA. You may use the GlobCover land cover map for educational and/or scientific purposes, without any fee on the condition that you credit ESA and the Université Catholique de Louvain as the source of the GlobCover products:
Copyright notice: © ESA 2010 and UCLouvain Accompanied by a link to our ESA DUE GlobCover website: http://due.esrin.esa.int/page_globcover.php Should you write any scientific publication on the results of research activities that use GlobCover products as input, you shall acknowledge the ESA GlobCover 2009 Project in the text of the publication and provide ESA with an electronic copy of the publication ([email protected]). If you wish to use the GlobCover 2009 products in advertising or in any commercial promotion, you shall acknowledge the ESA GlobCover 2009 Project and you must submit the layout to ESA for approval beforehand ([email protected]).
GlobCover class identifiers
| Class identifier | Description |
|---|---|
| 11 | Post-flooding or irrigated croplands (or aquatic) |
| 14 | Rainfed croplands |
| 20 | Mosaic cropland (50-70%) / vegetation (grassland/shrubland/forest) (20-50%) |
| 30 | Mosaic vegetation (grassland/shrubland/forest) (50-70%) / cropland (20-50%) |
| 40 | Closed to open (>15%) broadleaved evergreen or semi-deciduous forest (>5 m) |
| 50 | Closed (>40%) broadleaved deciduous forest (>5 m) |
| 60 | Open (15-40%) broadleaved deciduous forest/woodland (>5 m) |
| 70 | Closed (>40%) needleleaved evergreen forest (>5 m) |
| 90 | Open (15-40%) needleleaved deciduous or evergreen forest (>5 m) |
| 100 | Closed to open (>15%) mixed broadleaved and needleleaved forest (>5 m) |
| 110 | Mosaic forest or shrubland (50-70%) / grassland (20-50%) |
| 120 | Mosaic grassland (50-70%) / forest or shrubland (20-50%) |
| 130 | Closed to open (>15%) (broadleaved or needleleaved, evergreen or deciduous) shrubland (<5 m) |
| 140 | Closed to open (>15%) herbaceous vegetation (grassland, savannas or lichens/mosses) |
| 150 | Sparse (<15%) vegetation |
| 160 | Closed to open (>15%) broadleaved forest regularly flooded (semi-permanently or temporarily) - Fresh or brackish water |
| 170 | Closed (>40%) broadleaved forest or shrubland permanently flooded - Saline or brackish water |
| 180 | Closed to open (>15%) grassland or woody vegetation on regularly flooded or waterlogged soil - Fresh, brackish or saline water |
| 190 | Artificial surfaces and associated areas (Urban areas >50%) |
| 200 | Bare areas |
| 210 | Water bodies |
| 220 | Permanent snow and ice |
Roughness Length
Derived by meteoblue based on GLOBCOVER classification
| Field | Metadata |
|---|---|
| Name | Roughness Length |
| Long Name | Roughness Length (derived by meteoblue based on GLOBCOVER classification) |
| Version | 1.0 |
| Theme | Surface Roughness |
| Period of Time | Static |
| Spatial extent | 180°W to 180°E / 65°S to 90°N |
| Spatial resolution | 300 m |
| Coordinate system | WGS-84 |
| Earth model | WGS-84 |
| Spatial reference system | Plate Carreé grid |
| Publisher | meteoblue |
| Date First Published | 2005 |
| Homepage URL | www.meteoblue.com |
| Security Classification | Proprietary |
| Access Level | Defined in contract |
| Licence | meteoblue |
Description: Surface roughness length is a property of the surface which can be used to determine the way the horizontal wind speed varies with height. The wind speed at a given height decreases with increasing surface roughness. It is very common to have a heterogeneous surface and this complicates the vertical wind profile. Internal boundary layers develop and the profile of wind speeds is influenced by surface roughness changes upwind.
Moving downwind of a surface roughness change, the wind speed profile does not change at all heights immediately downwind. At first, only the lowest parts of the profile change, with the change progressively reaching higher and higher with increasing downwind distance from the roughness change. The impact of a roughness change can be felt many kilometers downwind. As a rule of thumb, at 100 m above the terrain, a surface roughness change 10-km upwind may still have an influence on wind speed.
Different surface roughness lengths result in different vertical profiles of wind speed. The y-axis is height above surface and the x-axis is wind speed. For a range of surface roughness lengths, the curves show the wind speed profile for neutral conditions and a geostrophic wind of 10 m/s.
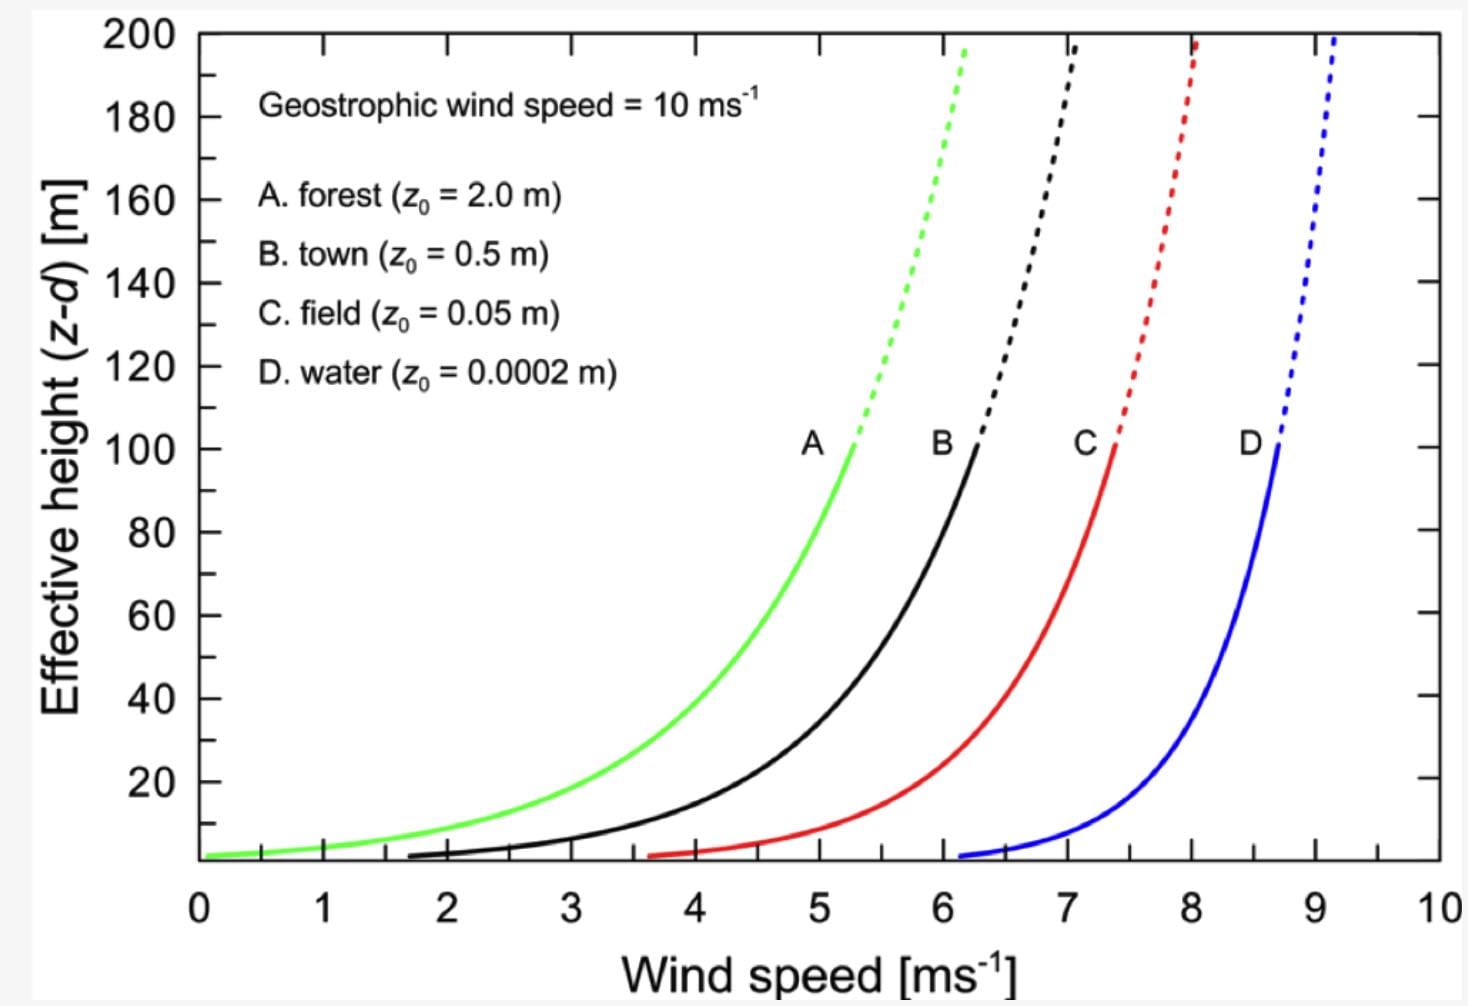
Topographical Data (DEM)
GMTED
Content: Cropland fraction, land fraction
| Field | Metadata |
|---|---|
| Name | GMTED |
| Short Name | GMTED250 / GMTED1000 |
| Long Name | Global Multi-resolution Terrain Elevation Data 2010 |
| Version | 1.0 |
| Theme | Terrain, elevation, digital elevation model |
| Period of Time | Static |
| Frequency | One-time |
| Spatial Type | Plate Carreé grid |
| Spatial extent | 180°W to 180°E / 56°S to 90°N (origin: 180.0°W / 55.999097222°S) for the 250m grid global, 180°W to 180°E / 90°S to 90°N (origin: 180.0°W / 89.9959722222°S) for the 1000m grid |
| Spatial resolution | 250 m (interpolated to delta lon: 0.0020833213°, delta lat: 0.0020833022°), 1 km (interpolated to 0.008333333°) |
| Coordinate system | WGS-84 |
| Earth model | WGS-84 |
| Publisher | U.S. Geological Survey (USGS) / National Geospatial-Intelligence Agency (NGA) |
| Date First Published | 2017 |
| Link to detailed specification | Danielson, J. J., and Gesch, D. B., 2011, Global multi-resolution terrain elevation data 2010 (GMTED2010): U. S. Geological Survey Open-File Report 2011–1073, 26 p. https://www.researchgate.net/publication/264159030_Global_Multi-resolution_Terrain_Elevation_Data_2010_GMTED2010 |
| Homepage URL | Link |
| Security Classification | Public |
| Access Level | https://www.usa.gov/government-works |
| Licence | Public |
Description: The U.S. Geological Survey (USGS) and the National Geospatial-Intelligence Agency (NGA) have collaborated on the development of a notably enhanced global elevation model named the Global Multi-resolution Terrain Elevation Data 2010 (GMTED2010) that replaces GTOPO30 as the elevation dataset of choice for global and continental scale applications. GMTED2010 is a major improvement in consistency and vertical accuracy over GTOPO30.
meteoblue has included the highest resolution available of GMTED2010, namely 250 m. Furthermore a 1 km resolution version is available. GMTED2010 incorporates the current best available global elevation data.
Population density - GPW4 v4.10 (2000, 2005, 2010, 2015, 2020)
Socioeconomic Data
GPW4
| Field | Metadata |
|---|---|
| Name | GPW |
| Long Name | Gridded population of the World |
| Version | 4.0, revision 10 |
| Theme | Population density: Number of persons per square kilometer |
| Period of Time | Static |
| Frequency | Based on population registers for the years 2000, 2005, 2010, 2015 (and 2020) |
| Spatial extent | 180°W to 180°E / 60°S to 85°N |
| Spatial resolution | 0.00833° (about 1 kilometer at the euqator) |
| Coordinate system | WGS-84 |
| Earth model | WGS-84 |
| Spatial reference system | Plate Carreé grid |
| Publisher | Center for International Earth Science Information Network - CIESIN |
| Date First Published | 2000 |
| Link to detailed specification | Link |
| Homepage URL | Link |
| Security Classification | Public |
| Licence | Licenced under the Creative Commons Attribution 4.0 International Licence |
Description: Gridded Population of the World, Version 4 (GPWv4) Population Density, Revision 10 consists of estimates of human population density (number of persons per square kilometer) based on counts consistent with national censuses and population registers, for the years 2000, 2005, 2010, 2015, and 2020. A proportional allocation gridding algorithm, utilizing approximately 13.5 million national and sub-national administrative units, was used to assign population counts to 30 arc-second grid cells. The population density rasters were created by dividing the population count raster for a given target year by the land area raster. The data files were produced as global rasters at 30 arc-second (~1 km at the equator) resolution.
DRYAD
The following DRYAD datasets are available:
- 1 km Gross Domestic Product (GDP) per grid cell (in DRYAD_GDP) for the Years 2000, 2010, 2015
Description: The GDP (PPP) data represents average gross domestic production of each grid cell. GDP is given in 2011 international US dollars. The data is derived from GDP per capita (PPP), which is multiplied by gridded population data from Global Human Settlement (GHS). Dataset has a global extent at 30 arc-second resolution for three time steps: 1990, 2000, and 2015.
- 10 km GDP per grid cell (in DRYAD10), 1990 - 2015 (yearly data)
Description: This global dataset represents the gross domestic production (GDP) of each grid cell. GDP is given in 2011 international US dollars. The data is derived from GDP per capita (PPP) which is multiplied by gridded population data HYDE 3.2 (the years of population data not available (1991-1999) were linearly interpolated at grid scale based on data from years 1990 and 2000). Dataset has global extent at 5 arc-min resolution for the 26-year period of 1990-2015.
- 10 km GDP per capita (in DRYAD10), 1990 - 2015 (yearly data)
Description: The GDP per capita (PPP) dataset represents average gross domestic production per capita in a given administrative area unit. GDP is given in 2011 international US dollars. Gap-filled sub-national data were used, supplemented by national data where necessary. Datagaps were filled by using national temporal pattern. Dataset has global extent at 5 arc-min resolution for the 26-year period of 1990-2015
- 10 km Human Development Index (HDI, in DRYAD10), 1990 - 2015 (yearly data)
Description: The HDI is a composite index of average achievement in key dimensions of human development (dimensionless indicator between 0 and 1). This index is based on method introduced 2010 and updated 2011. The subnational data for HDI were collected from multiple national-level datasets, and national-level HDI was collected from UNDP. Years with missing data were interpolated over time thin plate spines, assuming smooth trend over time. The dataset has a global extent at 5 arc-min resolution, and the annual data is available for each year over 1990-2015. HDI sub-national data covers 39 countries and 66% of global population in 2015.
Quality:
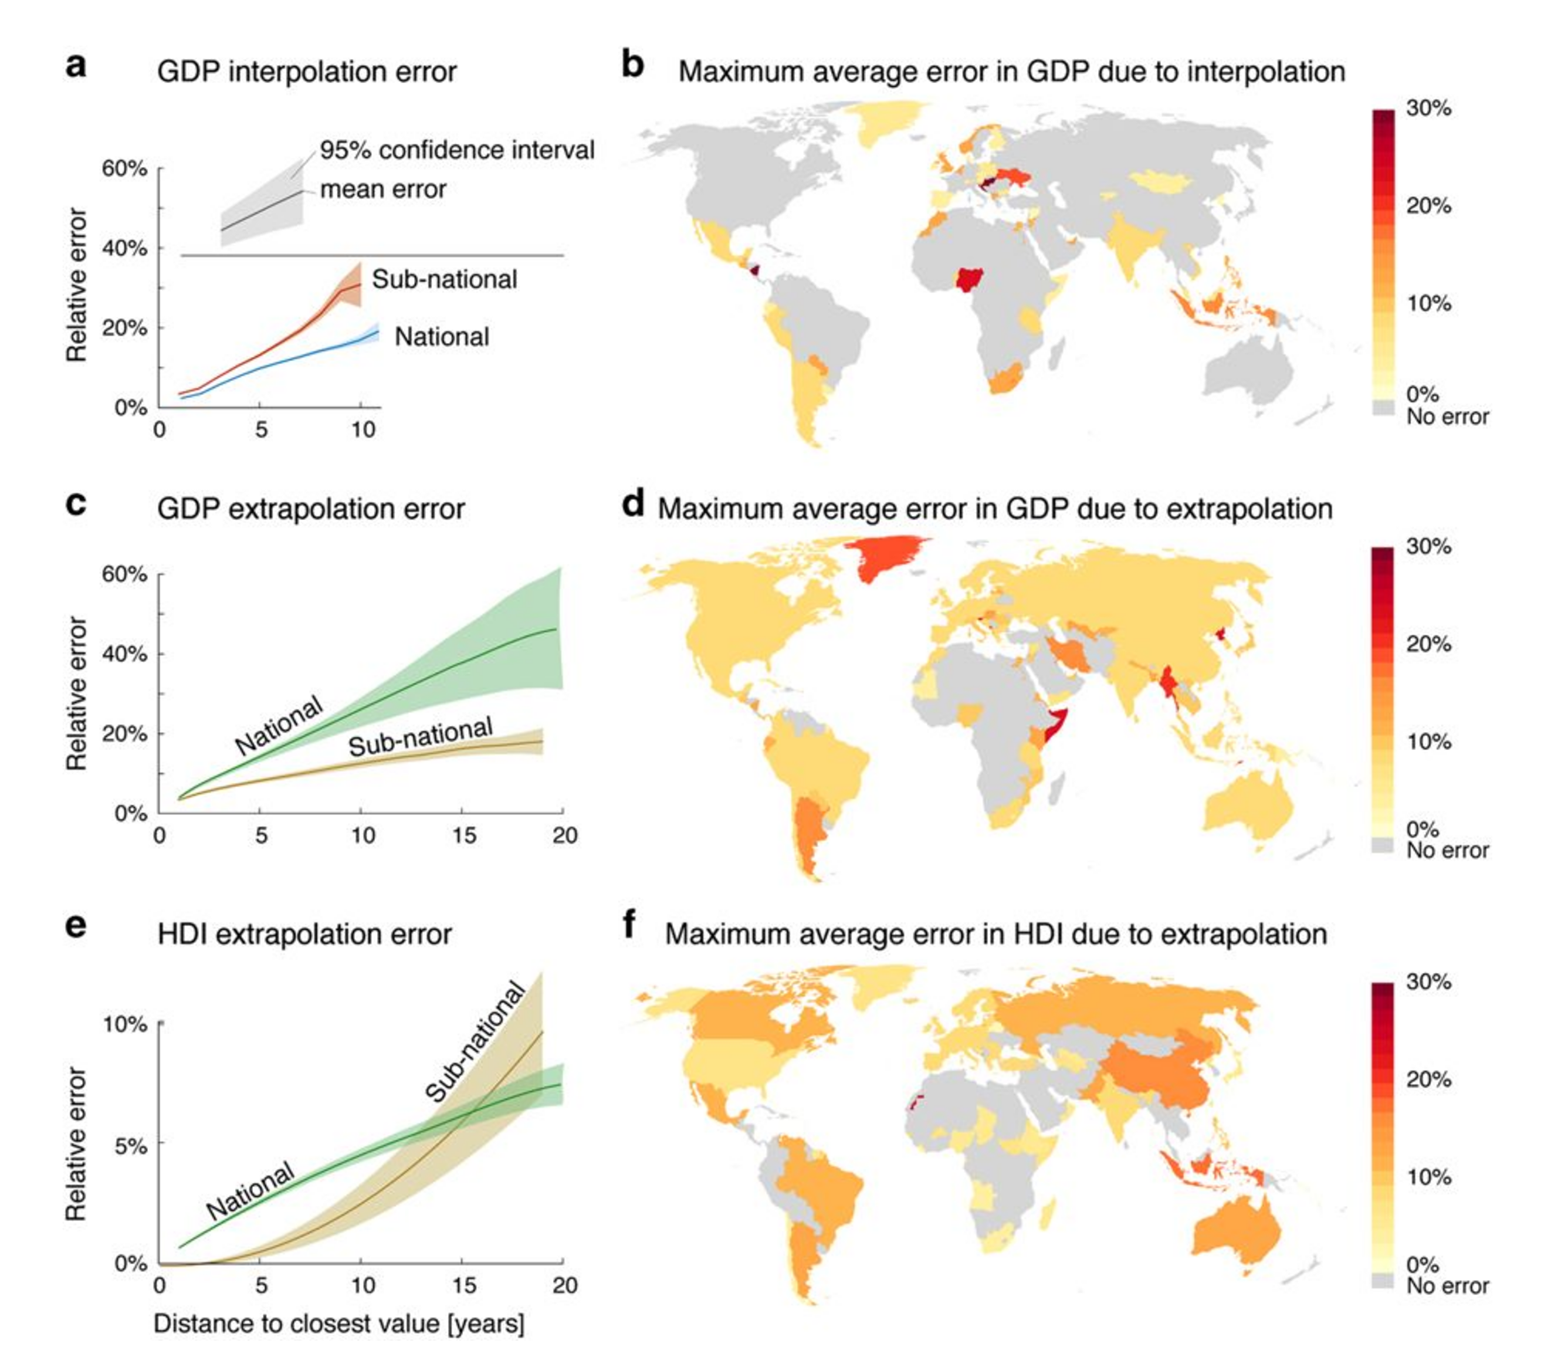
The error varies from year to year and we map here the maximum average error for each administrative area (either national or sub-national), which is estimated using the average of the global error analysis. The maximum temporal distance (in years) to the closest observed value is identified for each grid cell and the corresponding maximum average error is plotted. The error is therefore only indicative. Note: different scale in GDP and HDI plots; and no interpolation was needed for HDI dataset, and thus, results are not available.
Licence: When using this data, please cite the original publication: Kummu M, Taka M, Guillaume JHA (2018) Gridded global datasets for Gross Domestic Product and Human Development Index over 1990-2015. Scientific Data 5: 180004. https://doi.org/10.1038/sdata.2018.4
Additionally, please cite the Dryad data package: Kummu M, Taka M, Guillaume JHA (2018) Data from: Gridded global datasets for Gross Domestic Product and Human Development Index over 1990-2015. Dryad Digital Repository. https://doi.org/10.5061/dryad.dk1j0