Renewable MOS
Description
Renewable MOS (Model output statistics) is a localised power forecast based on the radiation or wind forecast of multiple weather models and historical power measurements of wind turbines or solar power plants. Thereby, the model output is corrected statistically by the function developed from the measurement data (Model Output Statistics), using the weather forecasts from multiple models as a basis. The forecast is adjusted to the local station, using quality-controlled measurements from the site which needs to be available over at least 1 year and in hourly intervals.
General Process
Power forecasts can be optimized by using statistical post-processing algorithms. The improvement of the forecast is depending on several site-specific conditions. On average, an improvement of 30% (e.g. reduce MAE from 35% to 25%) is realistic. To assure the functionality of the post-processing algorithms, a quality-control procedure for the measurement data is crucial.
For each MOS training meteoblue applies the following procedure:
-
Delivery of measurement data in standard format
-
Measurement quality control
-
Forecast API configuration
-
Delivery of MOS setup report
Methodology
meteoblue algorithms use a conditional MOS, which combines a simple neural network with improved meteoblue MOS technology. The algorithms differentiate between multiple weather conditions to find the best fit of linear regression for more than 30 weather variables from multiple weather models. The resulting forecast algorithm is individually designed for the specific site and provides the best possible forecast (state of the art) via a special API set for the specific application and location.
MOS Forecast Variables
The possible forecast variables and range/intervals are:
· Solar Energy_kWh; (availability variable is necessary to calculate kWh/kWp)
· Wind Energy_kWh; (availability variable is necessary to calculate kWh/kWp)
Other variables can be supplied on request.
Configuration Process
The MOS power forecasting model is determined based on the forecast of radiation or wind speed. The forecast is adjusted to the local power plant by a statistical function, derived from past measurements, as follows:
-
Customer provides location information: position, altitude
-
Customer provides power plant information:
- Solar: Capacity (kWp), exposition (slope, facing), plant type
- Wind: Capacity (kWp), turbine type, turbine height, number of turbines
-
Customer provides measurement time series in standardised format and UTC time
-
meteoblue conducts data quality control, to ensure a good return on investment
-
meteoblue extracts archived weather data and finds best statistical correlation
-
meteoblue implements correction factors into the API forecast system
-
meteoblue provides corrected MOS power forecast with 24 updates per day
Observational Data Format
It is recommended to provide at least one year of data in hourly time resolution to train the renewable MOS. The data has to be provided in a standard format using comma separated files (.csv).
Apart from production time series, minimal metadata (header information) has to be supplied. The observational data for MOS configuration has to be provided along these conditions:
- standard text format: .csv oder .txt
- one file for each site, that contains the full available time range
- File name: SiteID_LAT_LON_timerange_variable_generationdate.csv.
Example: BSL1_47.56_7.57_20210101-20211231_PV_20221206.csv - The file contains different columns for SiteID, Date&Time (in UTC) and the target variable. Energy production (Energy_kWh) is always to be delivered together with the system availability (=available capacity (kWp) at a given time stamp).
Note: The SiteID must not contain any of the following delimiter: comma, hyphen, colon
Important: While we apply case specifically designed routines to detect issues with completeness, time-shifts and plausibility of the data, it is in the interest of the customer to provide the data in the highest possible quality. Undetected quality issues (such as reduced available kWp not being provided accordingly) can reduce the accuracy of the MOS.
Sample Files
Sample File Time Series:
SiteID;DateTime;Energy_kWh;kWp
BSL1;20210101T0700;0;1250
BSL1;20210101T0800;43.82;1250
BSL1;20210101T0900;274.66;1250
BSL1;20210101T1000;432.73;1250
BSL1;20210101T1100;522.57;1250
BSL1;20210101T1200;454.05;1250
BSL1;20210101T1300;460.68;1250
BSL1;20210101T1400;408.4;1250
BSL1;20210101T1500;291.55;1250
BSL1;20210101T1600;72;1250
Sample files:
- Sample File Station List (Note: Different tabs for wind and solar sites, applying sheet to be provided as .csv. Wind turbine IDs can be found here)
- Sample File Time Series
Accuracy Improvements
The expected accuracy of power forecast with the MOS forecast is between 5% and 25% rMAE on an hourly basis for the 2-24 hour forecast, depending on location and year. The value of statistical post processing differs depending on location and input data (measurements). The highest value of these methods can be observed for the exact configuration of PV yield forecast. Differences in site results are shown in figure below.
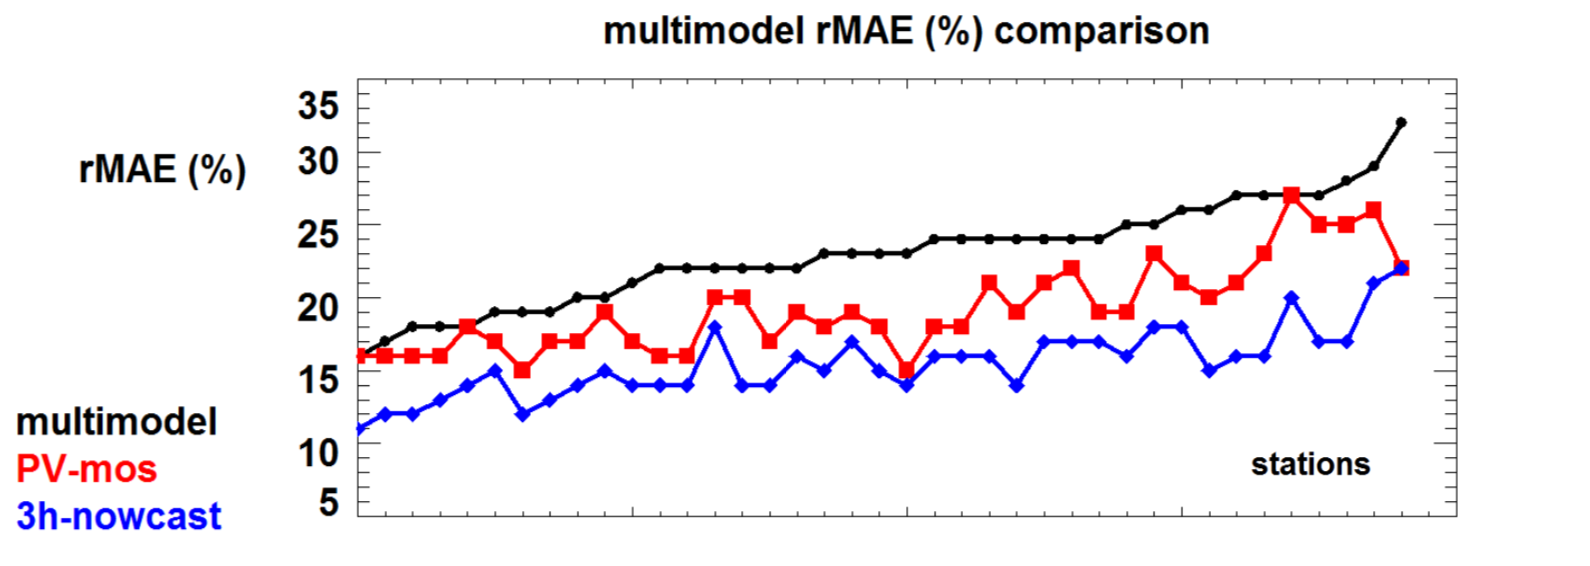
Hourly mean absolute errors (rMAE) of meteoblue day-ahead (multimodel & PV-Mos) and intraday (3h-nowcast) PV yield forecast validated on 38 PV systems in Central Europe.