Maps API Configurator
Introduction
The interactive Maps API configurator allows users to quickly configure their own map and embed it into their website or apps.
To configurate the maps plugin code the following options can be adjusted:
- Define API key
- Select map type
- Select zoom level
- Specify area by limiting “drag and pan”
- Select units
- Map appearance (size & meteoblue logo)
The generated HTML code can always be previewed as a code on the left side and as a map at the bottom of the page. Remember to actualise your settings with the ‘Generate code and preview’ button. Finally the generated code can be used to embed the map into your website or app.
Map Types
meteoblue offers various maps for many different weather variables. Users can select as many as needed and include it into their maps plugin. The selection menu also allows users to search for desired variables. The following maps are available:
Popular Maps
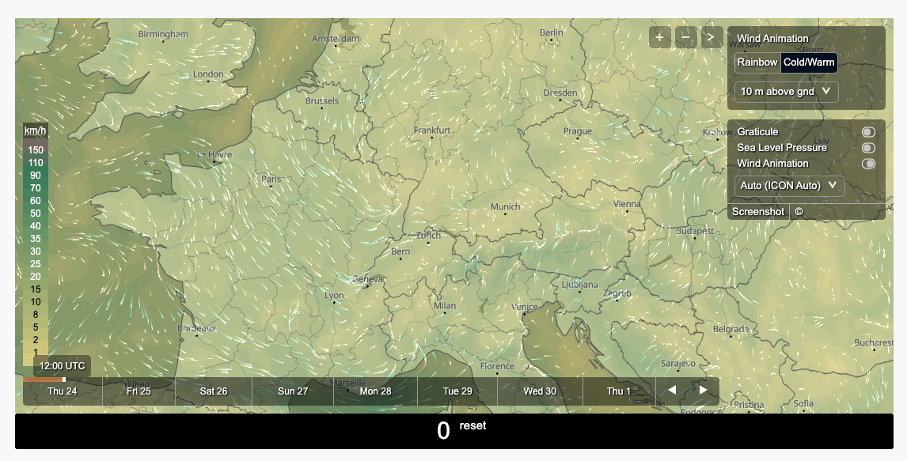
- Wind Animation
- Satellite
- Weather Radar
- Clouds & Precipitation
- Temperature
- Sunshine Hours
- Wind
- Wind Gust
- Relative Humidity
- Precipitation Probability
- Pressure & 3h Tendency
- 500 hPa Height
- 1000 – 500 hPa Thickness
- Temperature & Height (GPH)
Temperature & Humidity
- Apparent Temperature
- Freezing Level Height (0°C)
- Surface Inversion
- Temperature Change (Next 24h)
- Wetbulb Potential Temperature
- Dew point Temperature
- Vapor Pressure Deficit
- Evapotranspiration
- Potential Evapotranspiration
- Soil Moisture
- Soil Temperature
Precipitation
- Accumulated Precipitation
- Daily Precipitation
- Hourly Precipitation
- Accumulated Snowfall
- Daily Snowfall
- Hourly Snowfall
- Snow Depth
Aviation & Clouds
- Cloud Cover Total
- Low Clouds (0 – 3.5 km)
- Mid Clouds (3.5 – 8 km)
- High Clouds ( > 8 km)
- Cloud Height
- Convective Cloud Height
- Visibility
- Wind Convergence (10m)
- Convective Updraft
- Soaring Flight Distance
- Soaring Index
- Boundary Layer Height
- Clear Air Turbulence (CAT)
- In-Flight Icing
Sea & Surf
- Wave Height
- Wave Period
- Wave Peak Period
- Ocean Currents
- Sea Water Salinity
- Sea Ice Cover
- Water Surface Temperature
Air Quality & Pollen
- Air Quality (CAQI)
- Desert Dust
- Ozone
- Aerosol Optical Depth
- Particulate Matter
- SO2
- NO2
- CO
- Grass Pollen
- Ragweed Pollen
- Birch Pollen
- Olive Pollen
Seasonal Forecast
- Temperature Anomaly (2m)
- Temperature Anomaly (850 mb)
- Precipitation Anomaly
- Snow Depth Anomaly
- Evapotranspiration Anomaly
- Sea Level Pressure Anomaly
- Wind Speed Anomaly
- SST Anomaly (El Nino)
More Maps
- CAPE & Lifted Index
- Lifted Index
- Storm Helicity (0 – 3 km)
- Solar Radiation (GHI)
- UV Index
- Weather Risk
- Sea Level Pressure
- Temperature OBS
- Precipitation OBS
- People Indoor Bias
- Hiking Trail Map
Zoom Levels
Users can select a default zoom level, which will be used whenever user access the map. Using a default zoom level of “zero” will display the maximum size of the map, which the whole world. By increasing the zoom level, the map will show less of the world, but more detailed. Furthermore, users can select the minimum and maximum zoom level. Once that is selected, map users can only zoom in between these two zoom levels.
Drag and Pan
By configurating the map, users can also select to disable to “drag and pan”. Users can then limit the map to a certain area, so users will not be able to use the map outside that area. meteoblue uses regular WGS-84 latitude and longitude coordinates in decimal degrees format (47.56°N / 7.57°E). Coordinates with arc hours and seconds are not supported.
By not allowing to “drag and pan” users can only zoom in or out, but cannot move the map. This option is useful to control costs by reducing the amount of map tiles for each user.
Units
Different units can be chosen for each variable. User can select between a metric or imperial length unit to change the legend in the map displayed on the left side for maps with values in length units. For maps considering temperature, users can select between Celsius and Fahrenheit; for wind maps, between the beaufort scale, kilometers per hour, meters per second, miles per hour and knoten.
Map Appearance
The size of the map can be selected by choosing the width of the map in percent, which allows the map to be displayed relatively to the screen size of the user. The maximum height can be selected in pixels.
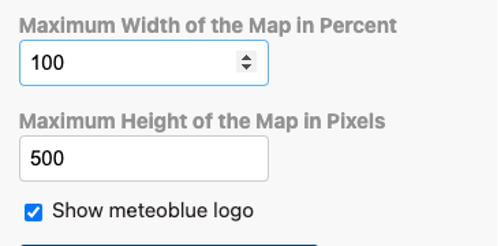
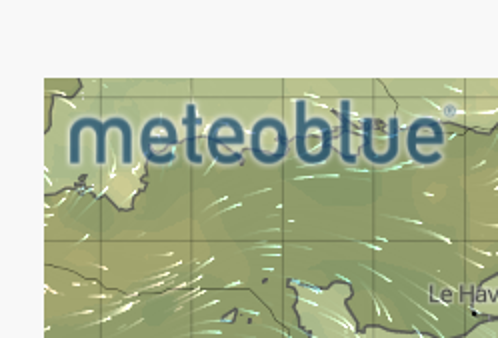
In addition, users can choose whether the meteoblue logo should be displayed on the map. Once it is selected the meteoblue logo will appear in the upper left corner of the map. The logo also contains a direct link to the meteoblue website, when clicking on it.
Tile count and preview
While configurating the map for websites or apps, users can always see a preview of their current settings as well as a tile count. The preview can be adapted to changes by clicking ‘Generate code and preview’. The tile count counts the number of tiles displayed and used when showing the map. It adjusts in real-time as soon as the user interacts with the map. This tile count provides the user an estimation of the usage of tiles on a website. It can also set to zero by clicking ‘reset’ next to the count.